

Sales Summary
Compare Sales
Payment Methods
All Product Sales
Category Sales
Discounts
Labor vs Sales
Modifier Sales
Platform Sales
Ticket Type Sales
Taxable Sales
Tax Categories
Time Cards
Team Sales
Cash Drawer
Invoicing
Ticket Completion
Sales Summary
The Sales Summary report offers a clear, concise snapshot of your shop’s key sales metrics over a selected time period. Use this report to identify trends, monitor performance, and make informed business decisions.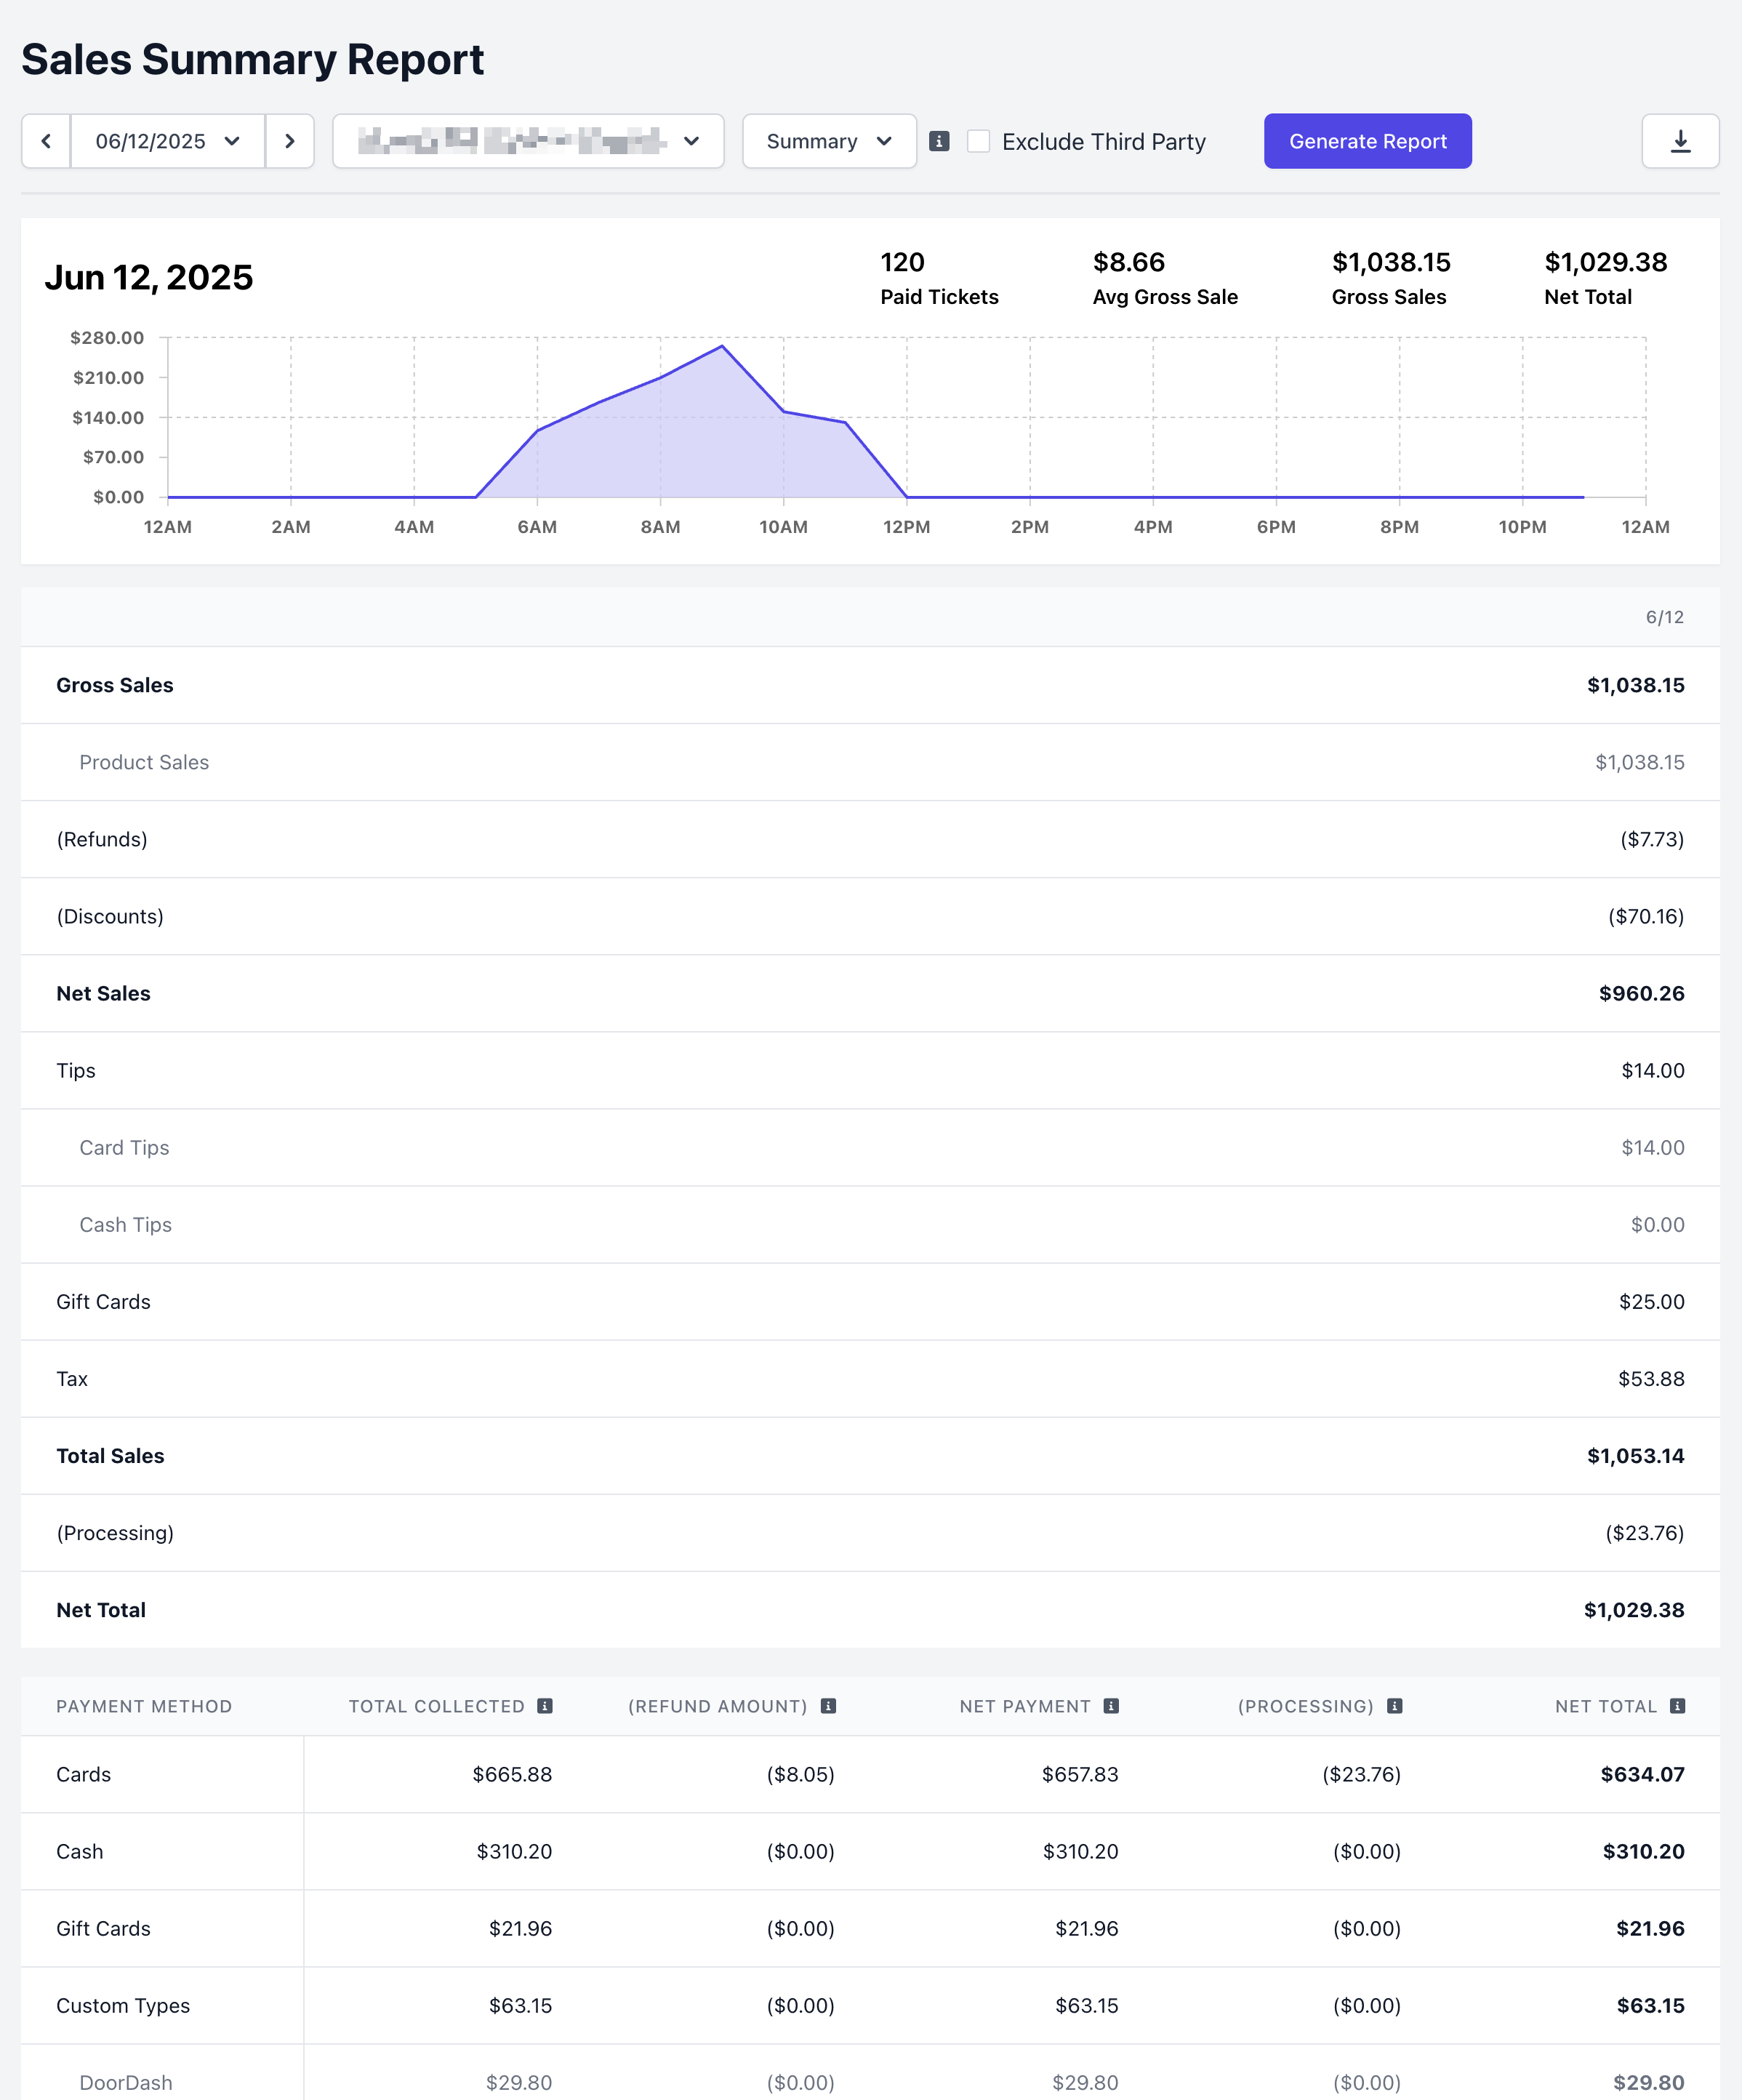
Report Line Items
Report Line Items
Gross Sales: All product sales
Product Sales: This represents the total amount of menu products sold during this period, without taking taxes into account.
Net Sales: Product sales minus refunds and discountsTips: Total amount of cash and card tips collectedGift Cards: Value amount off gift cards soldTax: Total amount of taxes collected through taxable salesTotal Sales: Net Sales plus tips, gift card sales, and taxesProcessing: Total fees accumulated from card payments, both present and not present, plus any payout feesNet Total: Total sales minus processing feesThe bottom portion of the report lists the payment methods associated with your sales: Cash, Cards, Gift Cards, and Custom Payment TypesTotal Collected: The total amount of sales collected, including taxes, fees, tips, and discountsRefund Amount: Total amount that was refunded from salesNet Payment: Total collected minus refundsProcessing: Total amount of fees accumulated from card payments, both present and not present, plus any payout feesNet Total: Net payment minus processing fees
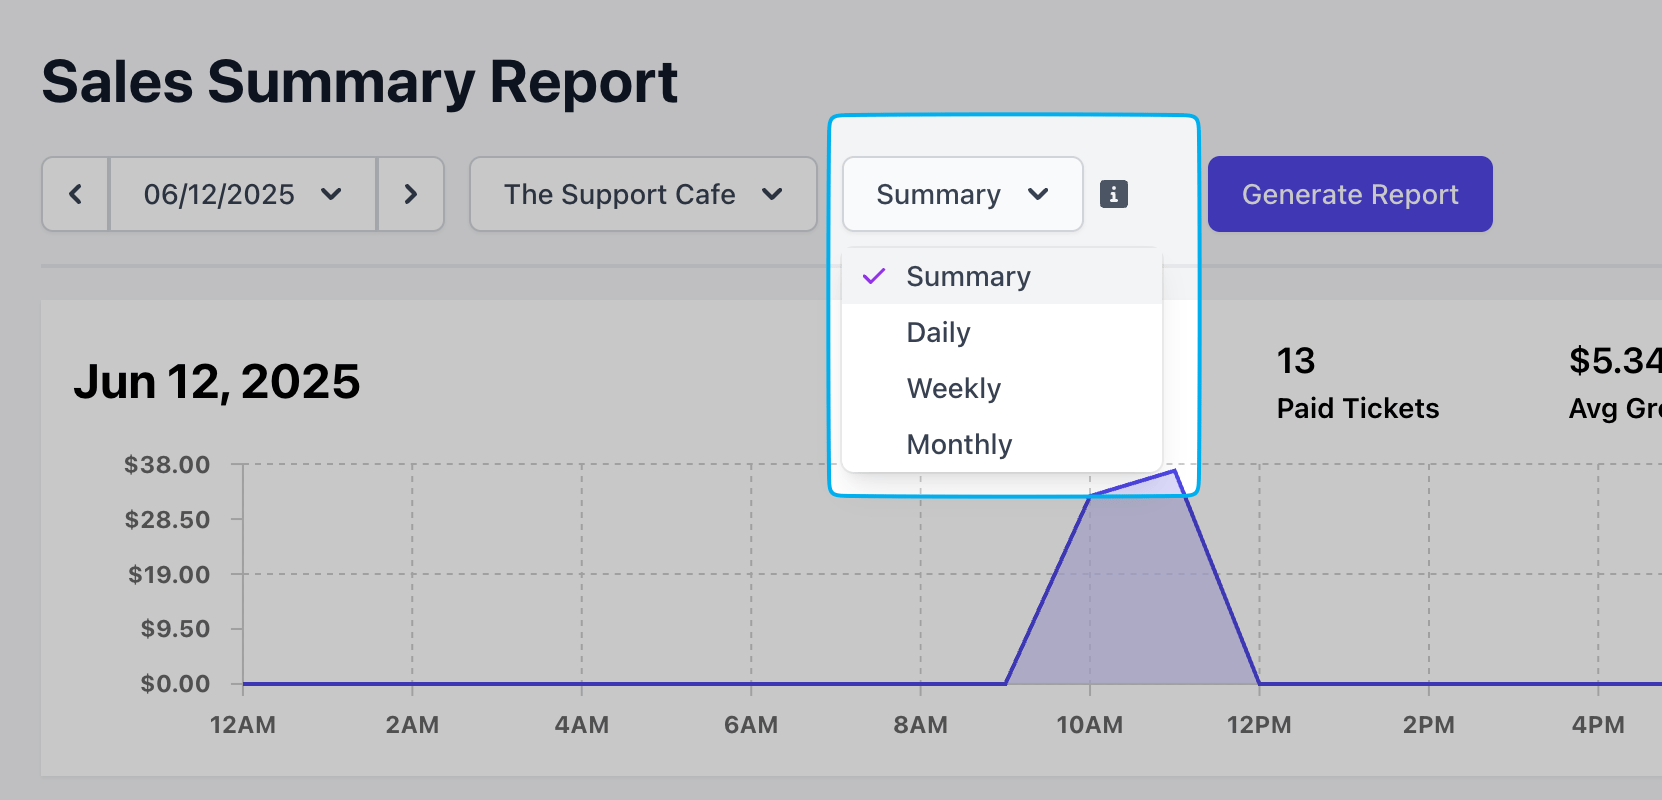
Report Views
Report Views
Daily
Select 2+ days from the calendar and view the daily report to see sales by day, as well the times of day with the most sales.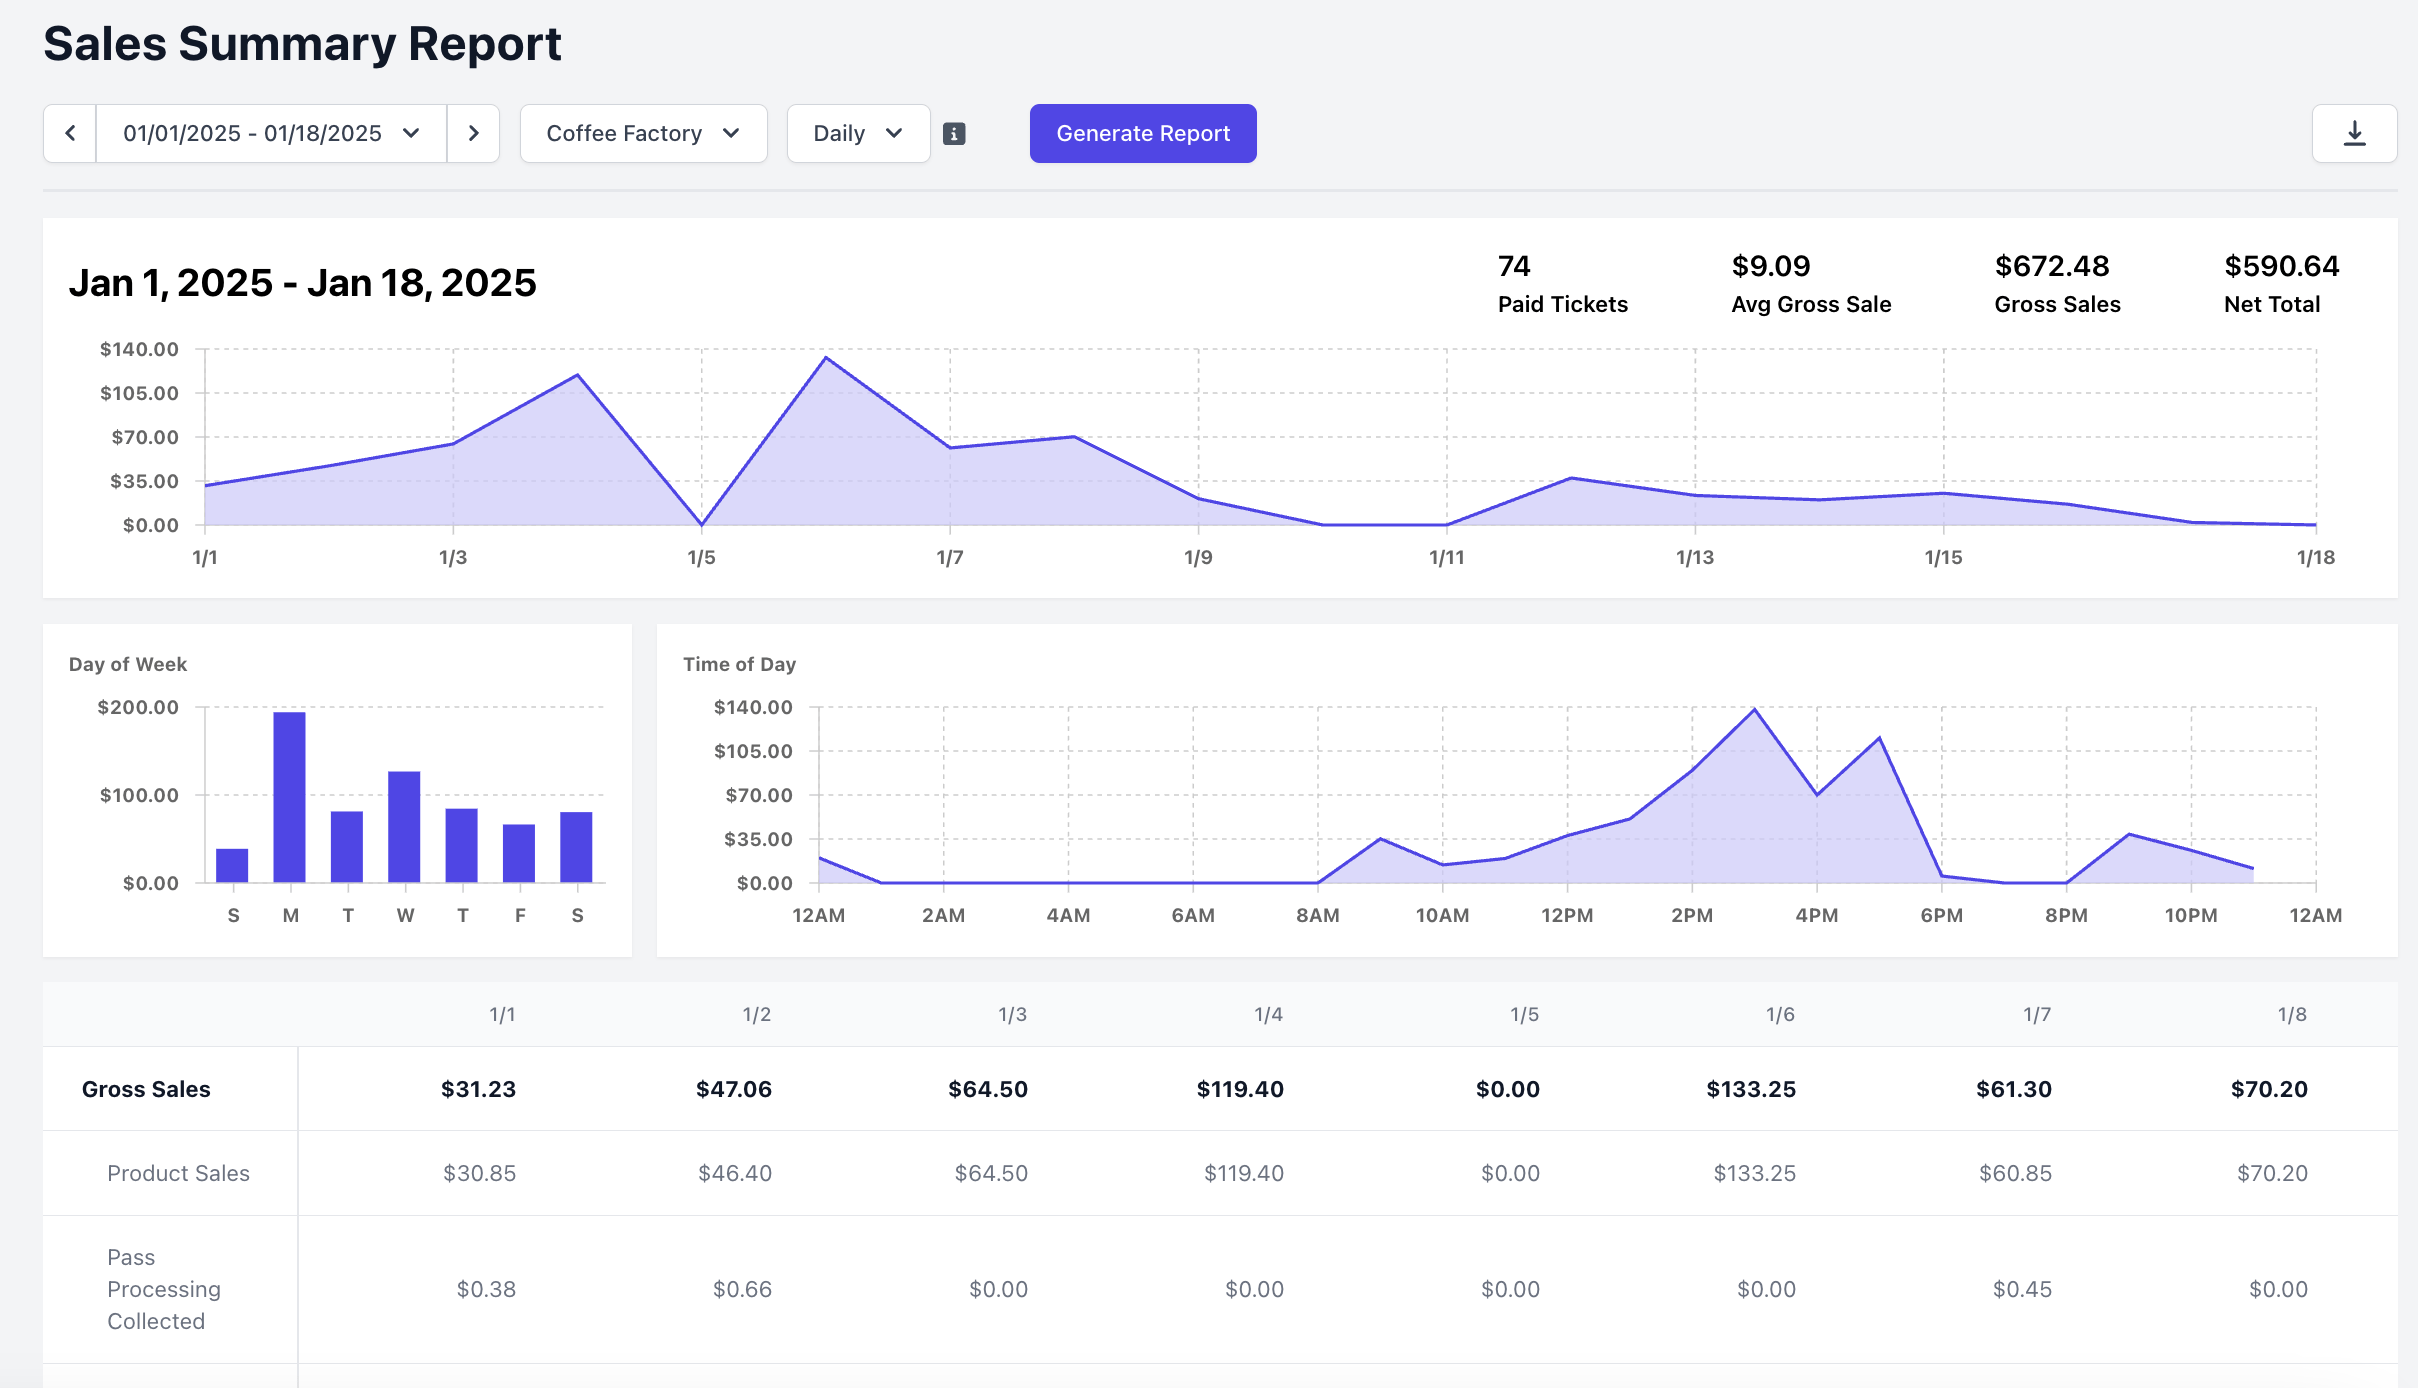
Weekly
Select 2+ weeks from the calendar and view the week report to see sales by week, as well the days of the week and time of day with the most sales.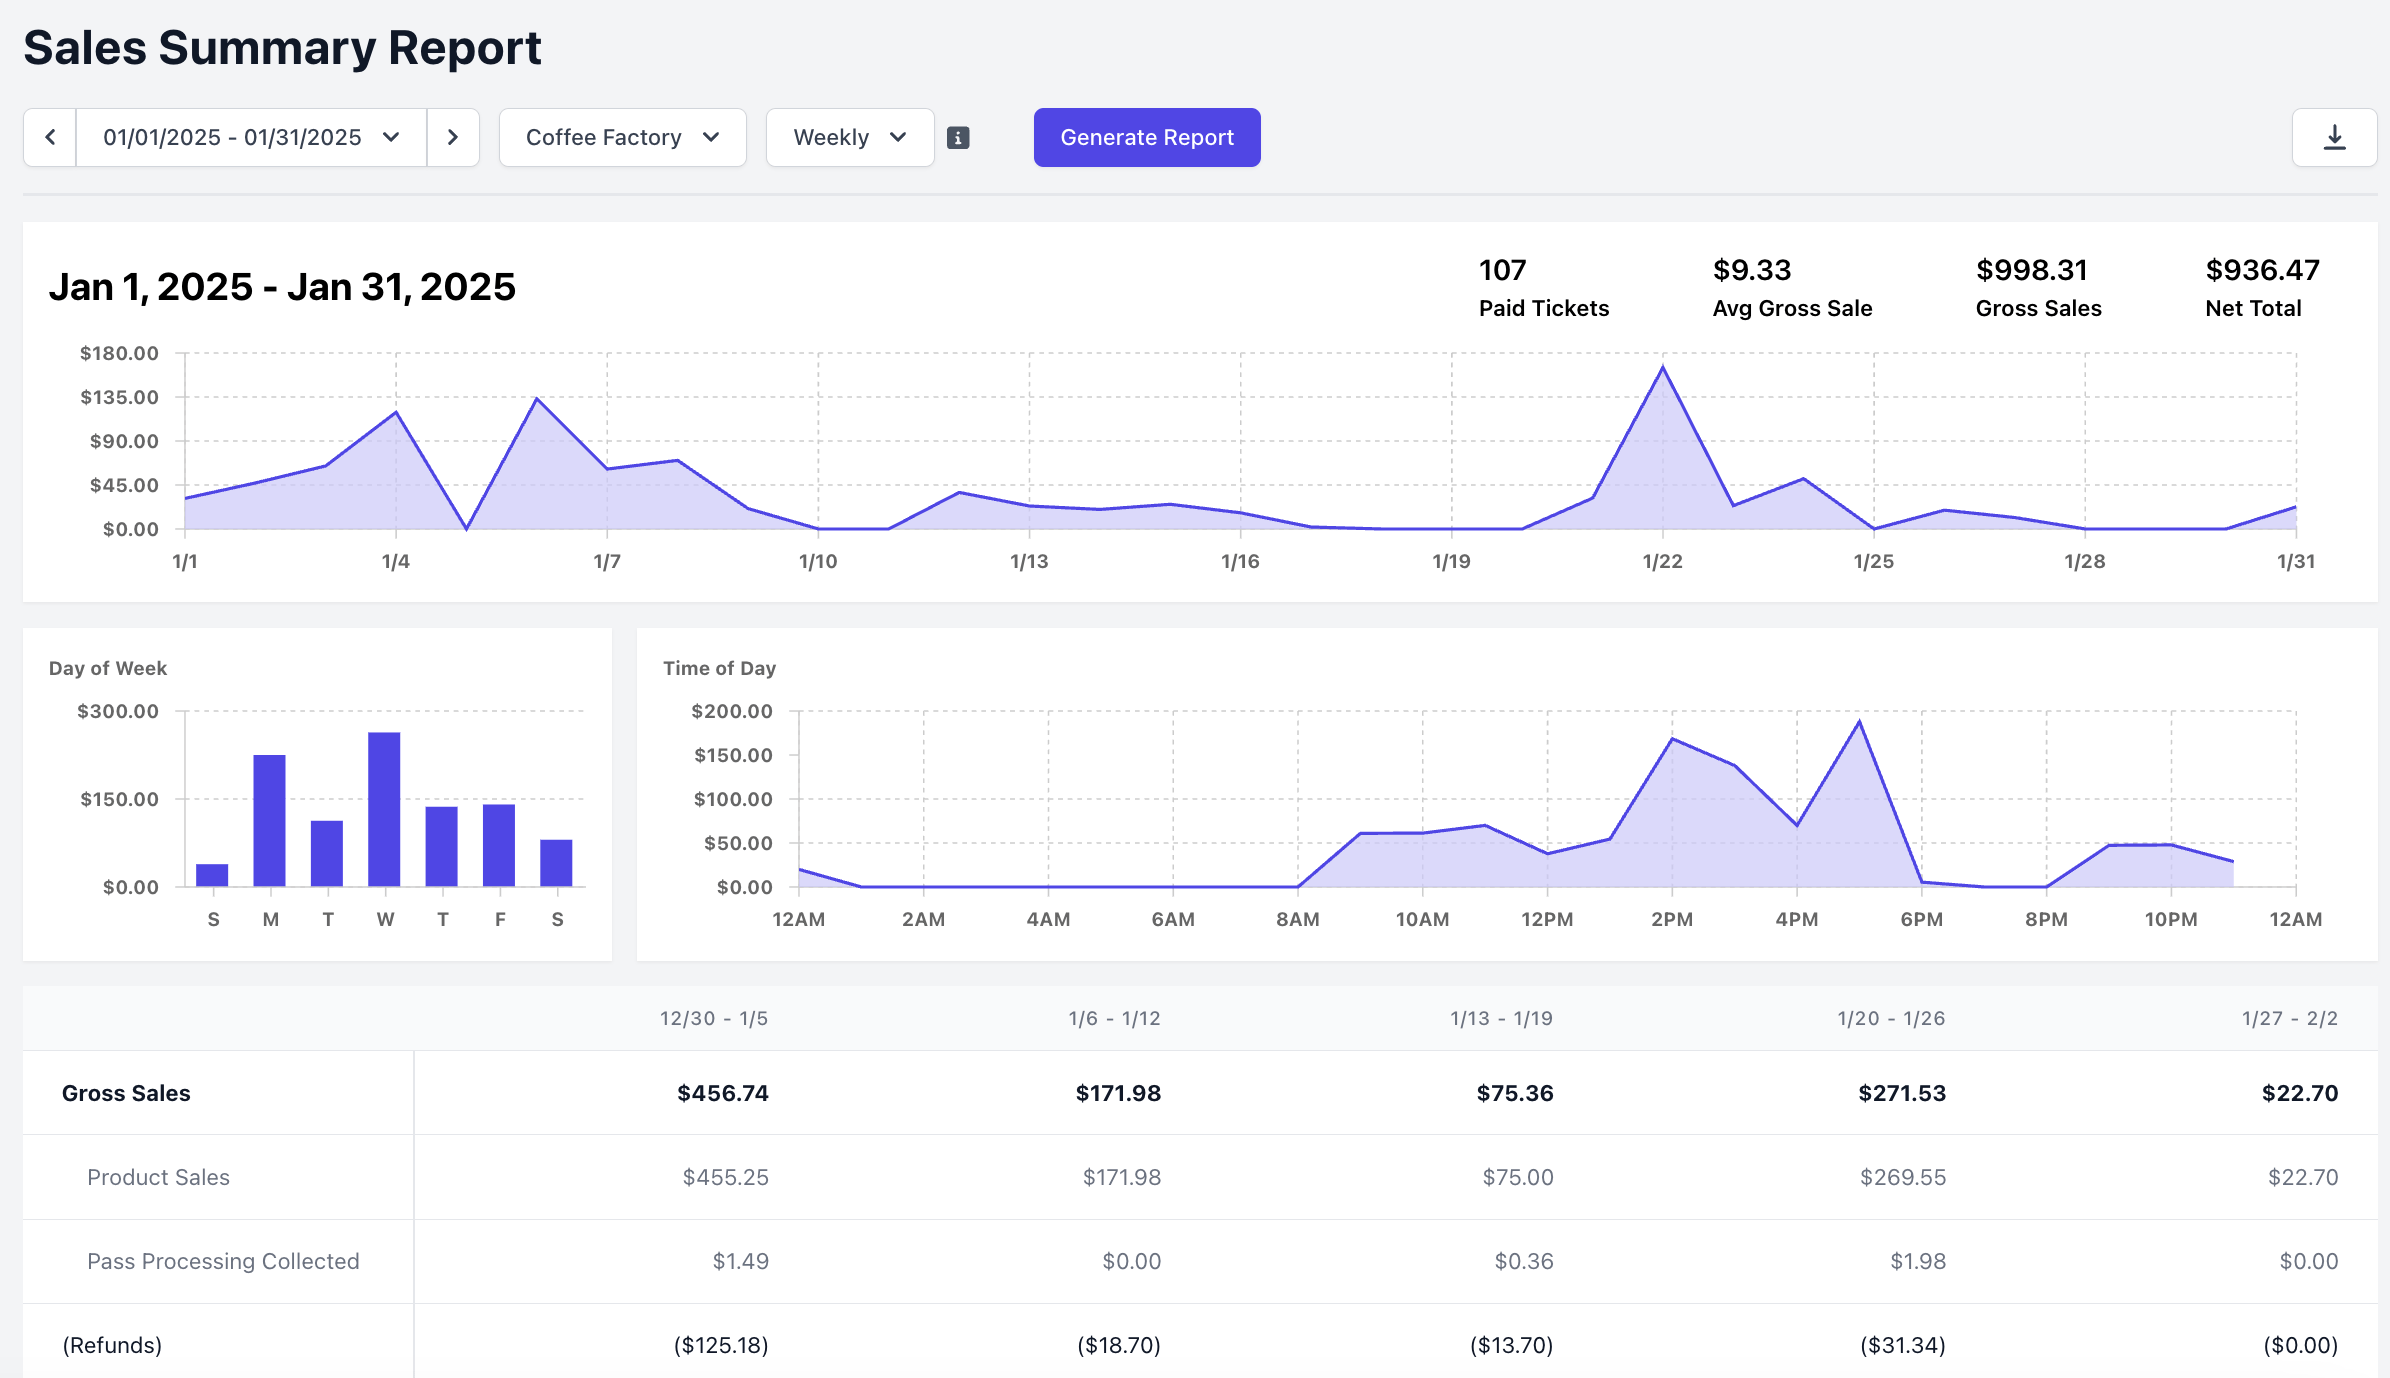
Monthly
Select 2+ months from the calendar and view the monthly report to see sales by month, as well the days of the week and time of day with the most sales.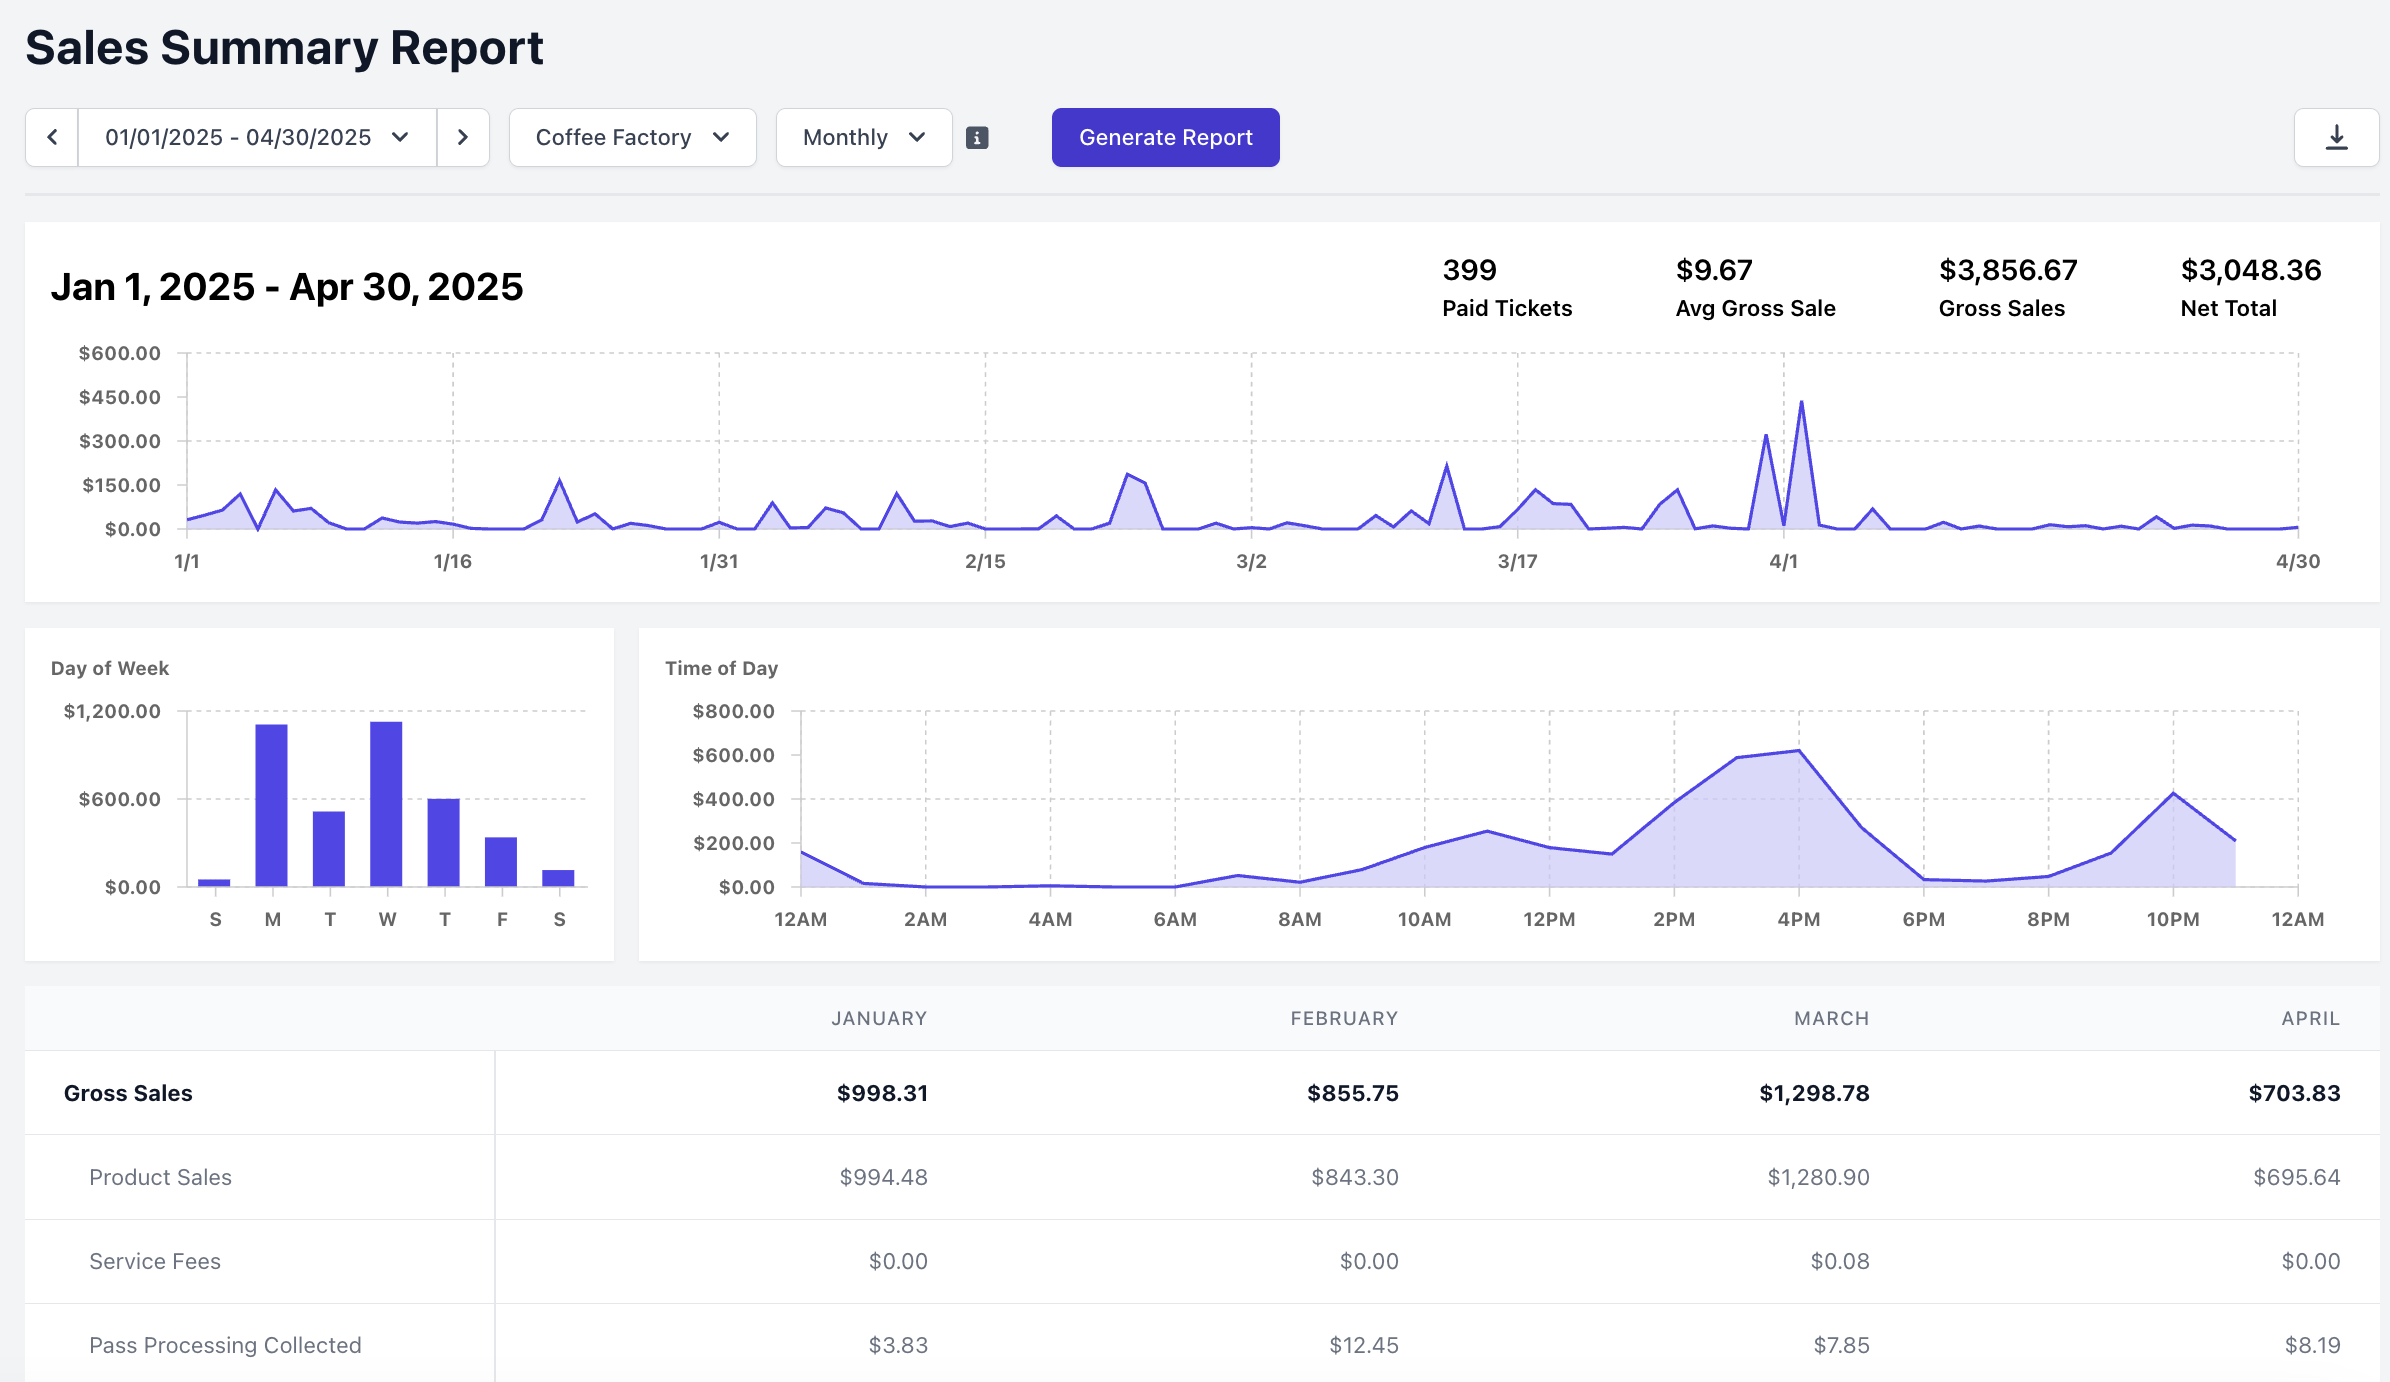
Compare Sales
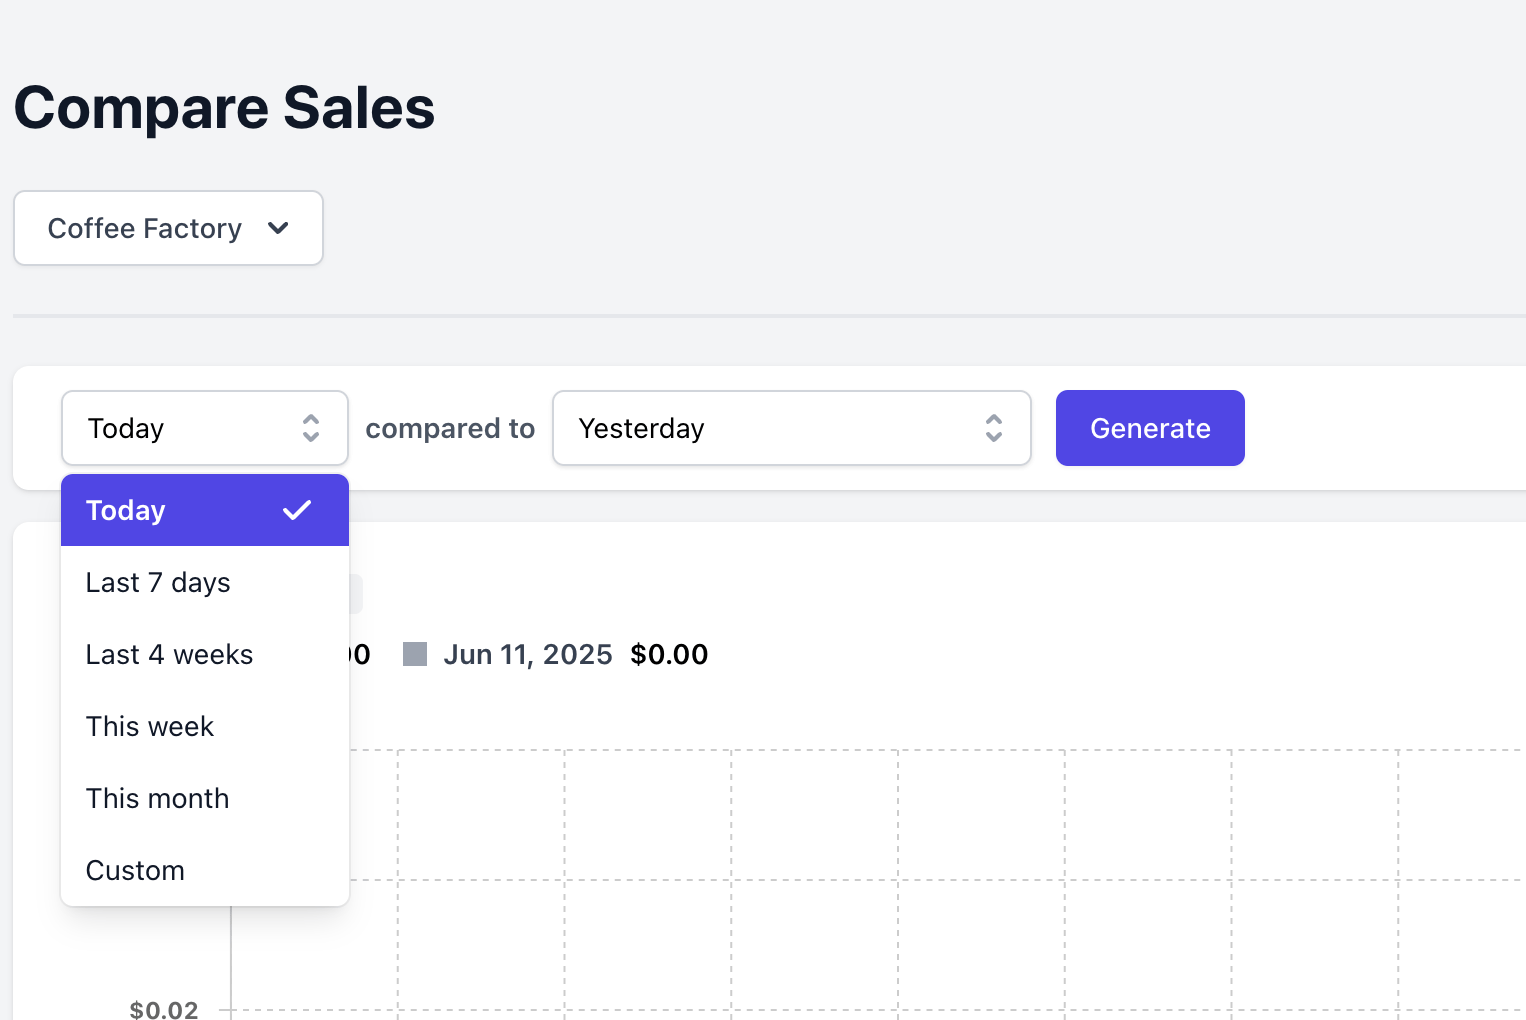
Use the Compare Sales Report to analyze sales performance across different time frames and dates, with the option to generate hour-by-hour comparison graphs. View the report on the Dashboard, Point of Sale, and Hub App.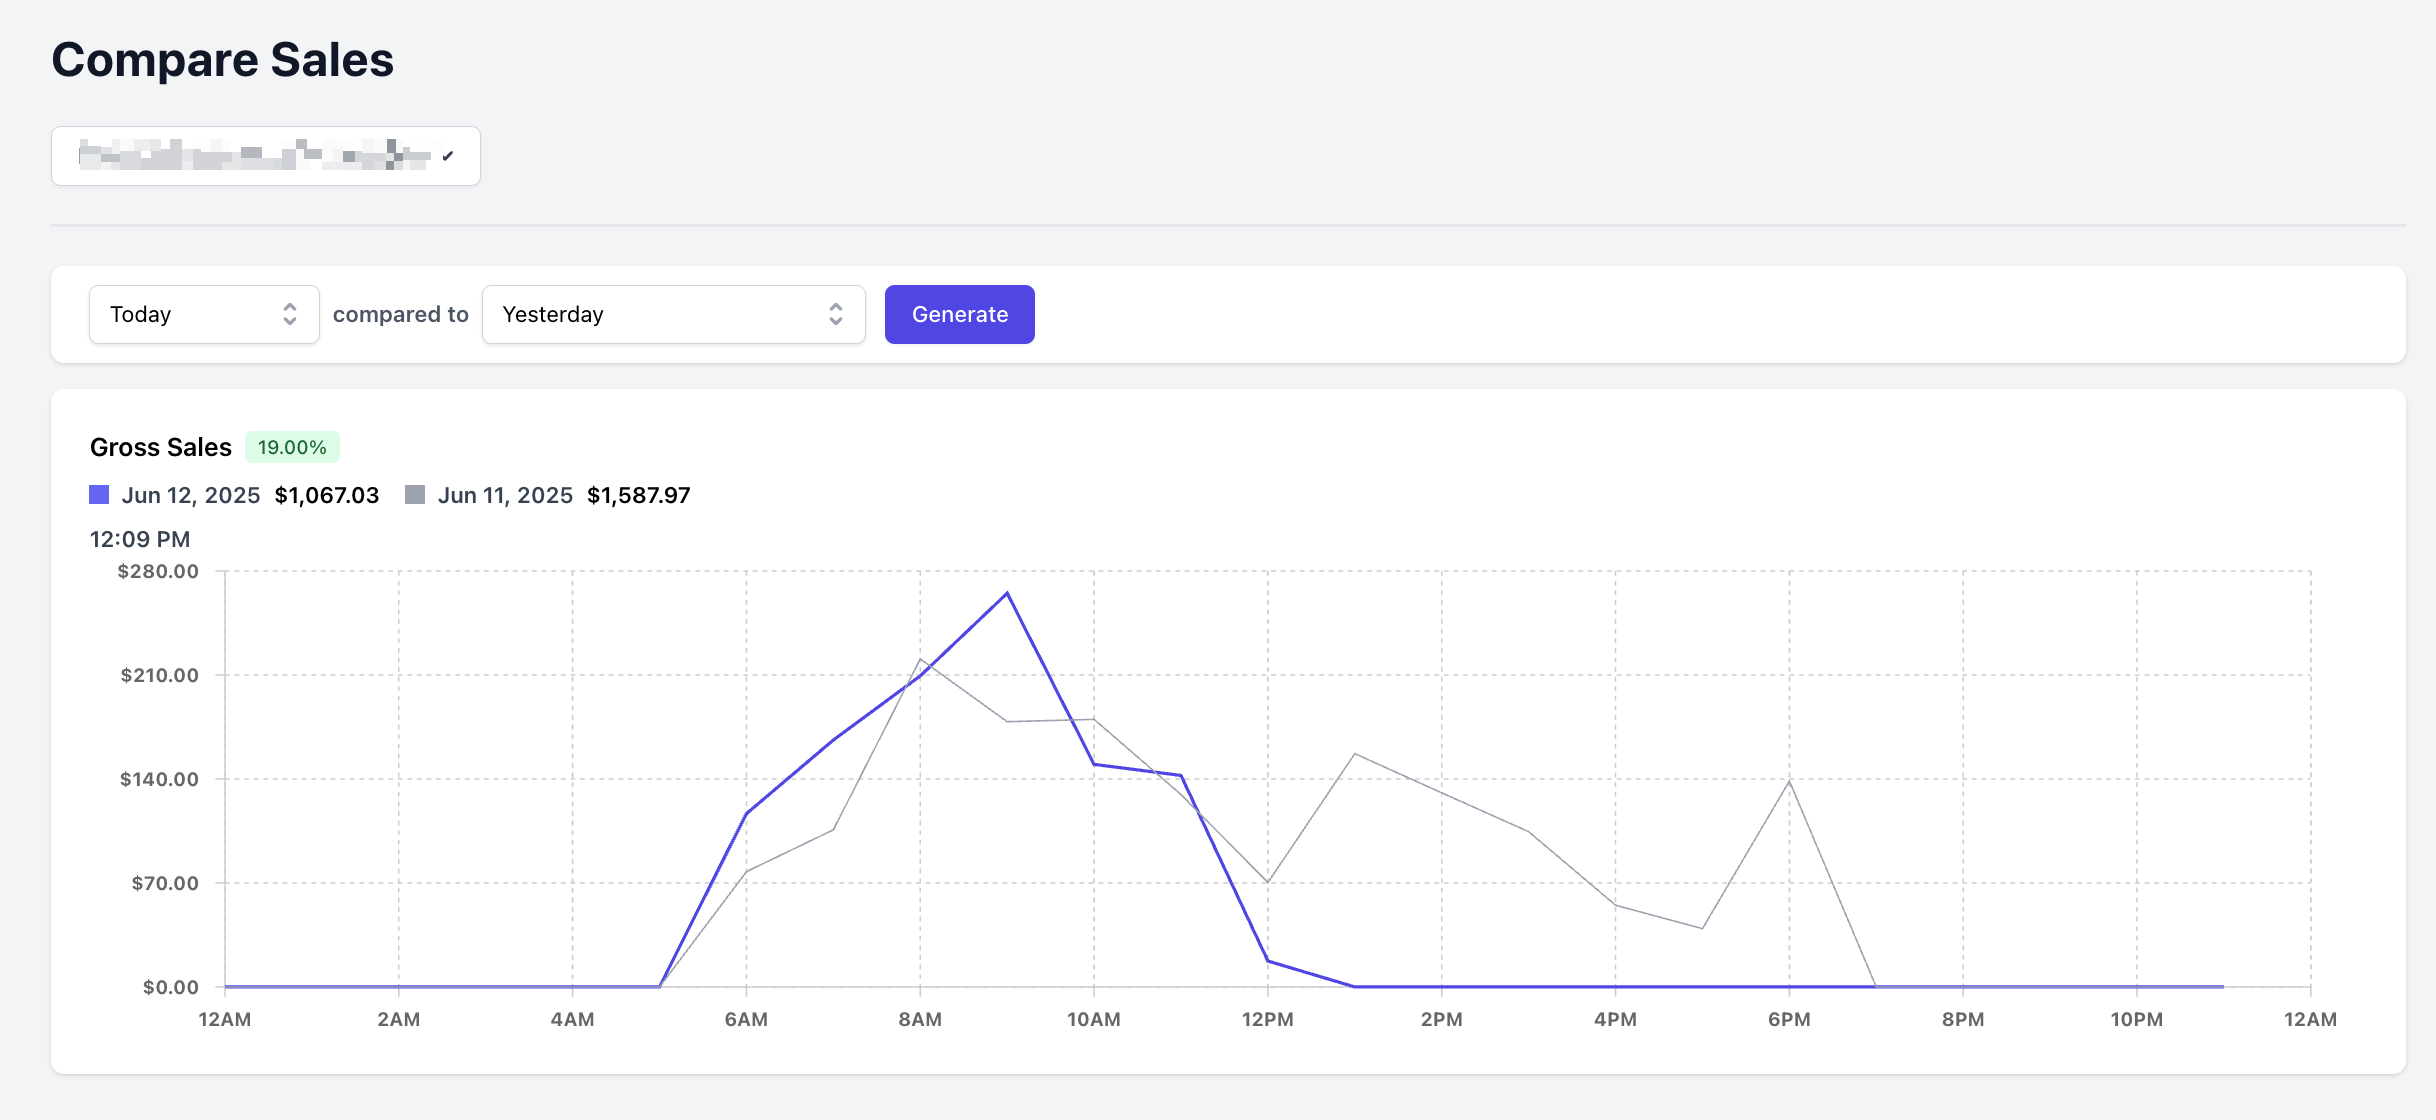
Payment Methods
The Payment Methods Report provides a detailed breakdown of sales by payment method. Access the Payment Methods Report from the Dashboard, Point of Sale, and Hub App.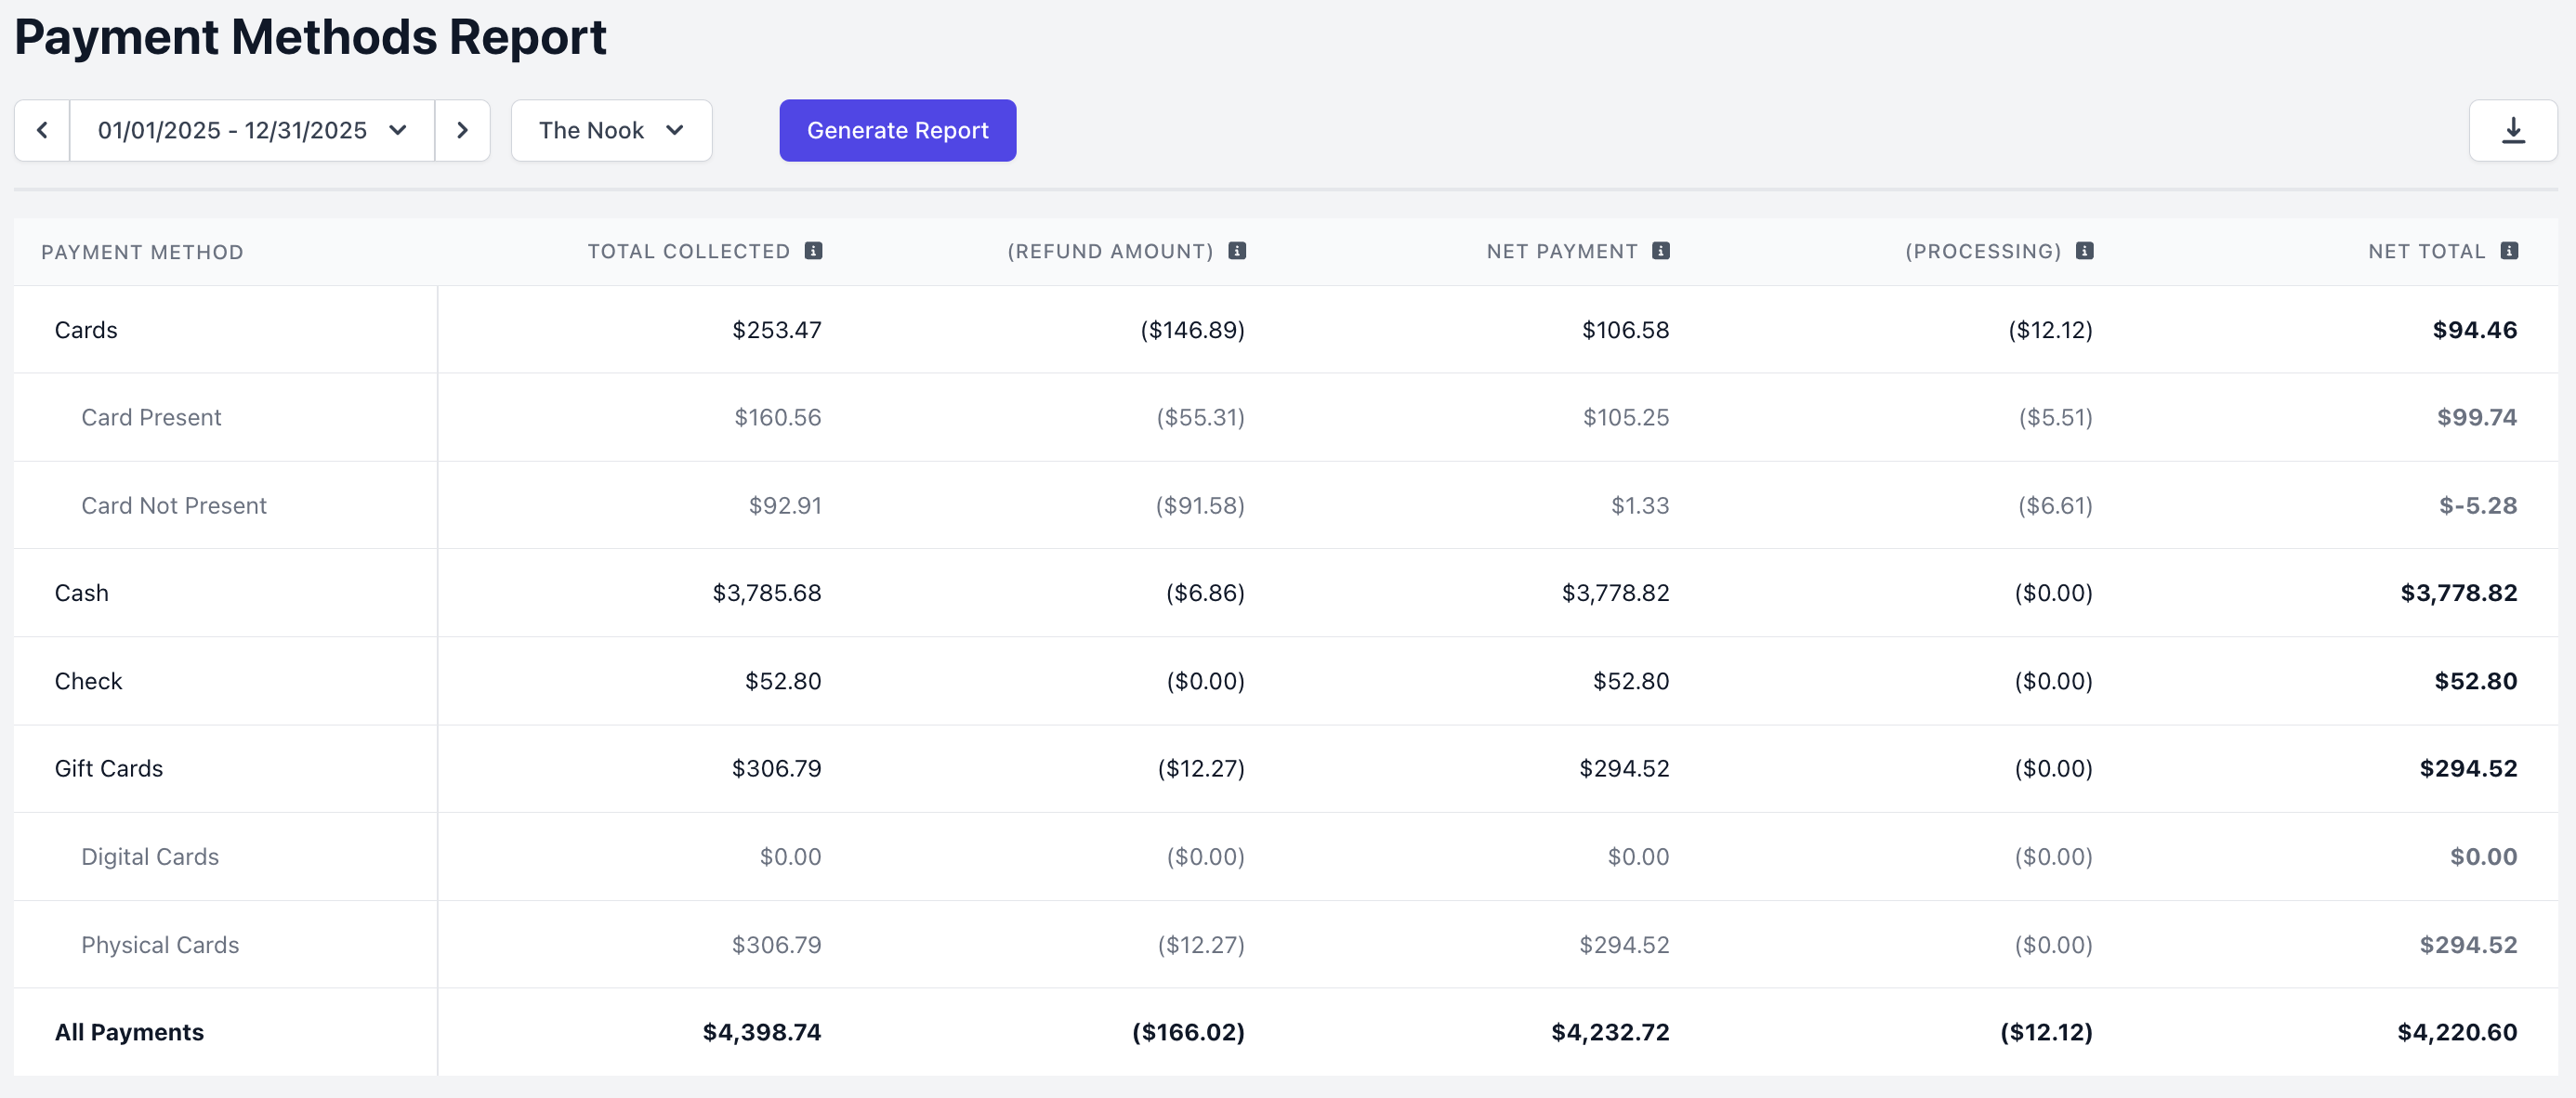
Report Line Items
Report Line Items
Time Period: Designate a time period for the reportLocation: For multi-location shops, select the desired location(s) to show taxable sales forPayment Method: The type of payment methodTotal Collected: The total amount of sales collected including taxes, collected fees, tips, and discountsRefund Amount: The total amount refunded from sales during your selected time periodNet Payment: The total amount of sales collected minus refundsProcessing: The total amount of fees collected from processing fees.Net Total: The total amount of sales collected minus refunds and processing fees.
All Products Sales
The product sales report allows you to view individual product performance within a selected period. View the report on the Dashboard, Point of Sale, and Hub App.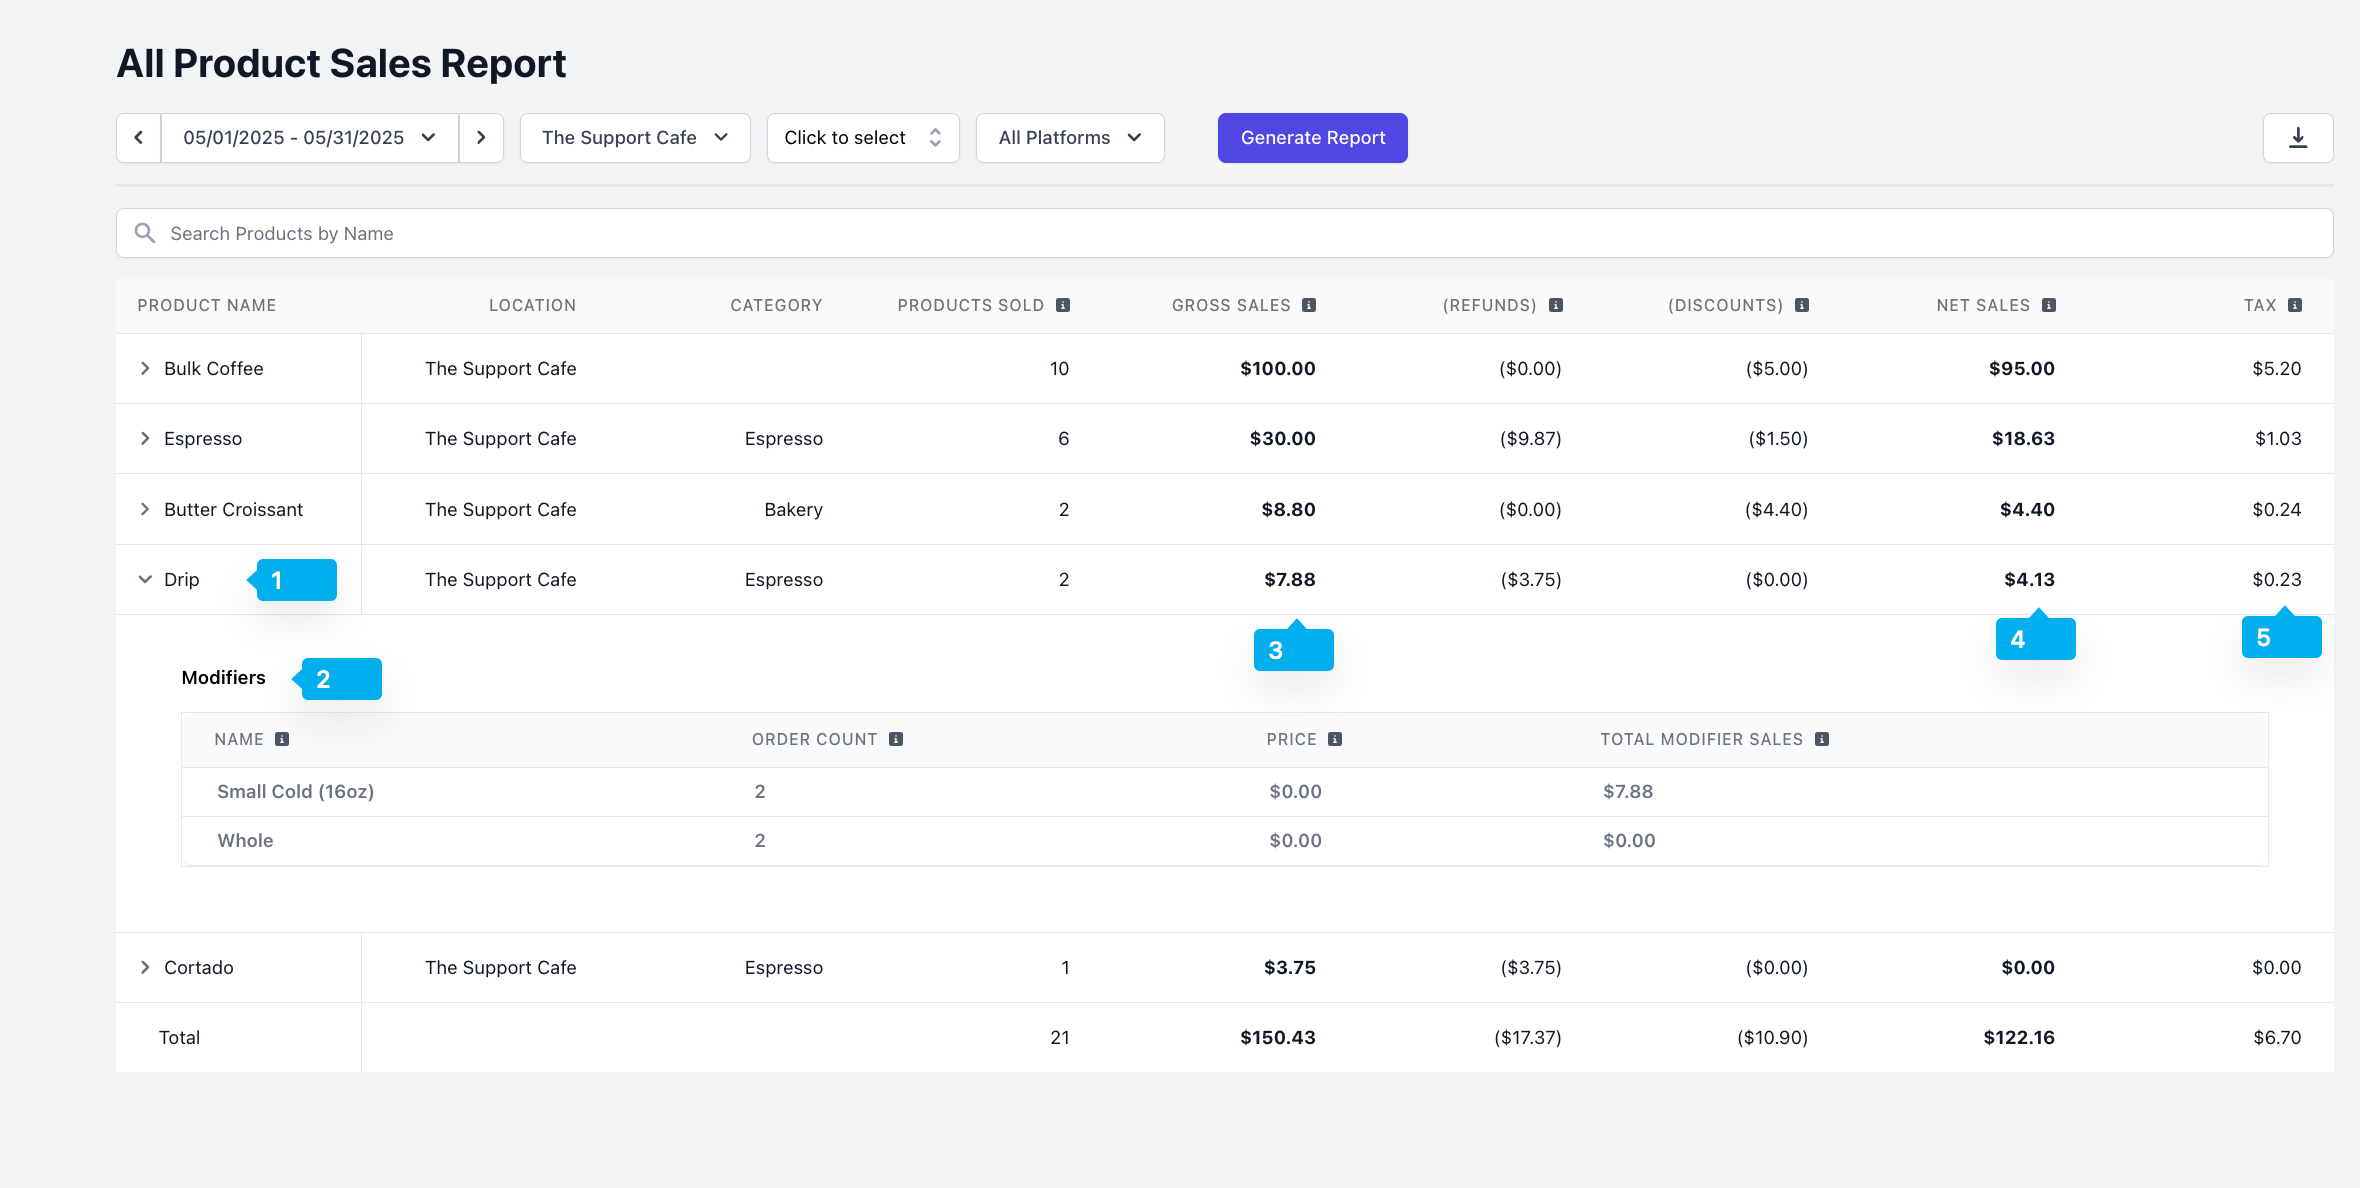
Report Line Items
Report Line Items
Product NameModifiers options sold under the productGross Sales: Total sales collected from the product, including sales that were refunded and discounted. This number does not include product taxes collected.Net Sales: Total sales collected from that product with refunds and discounts subtracted. This number does not include product taxes collected.Tax: The taxes collected from net product sales.
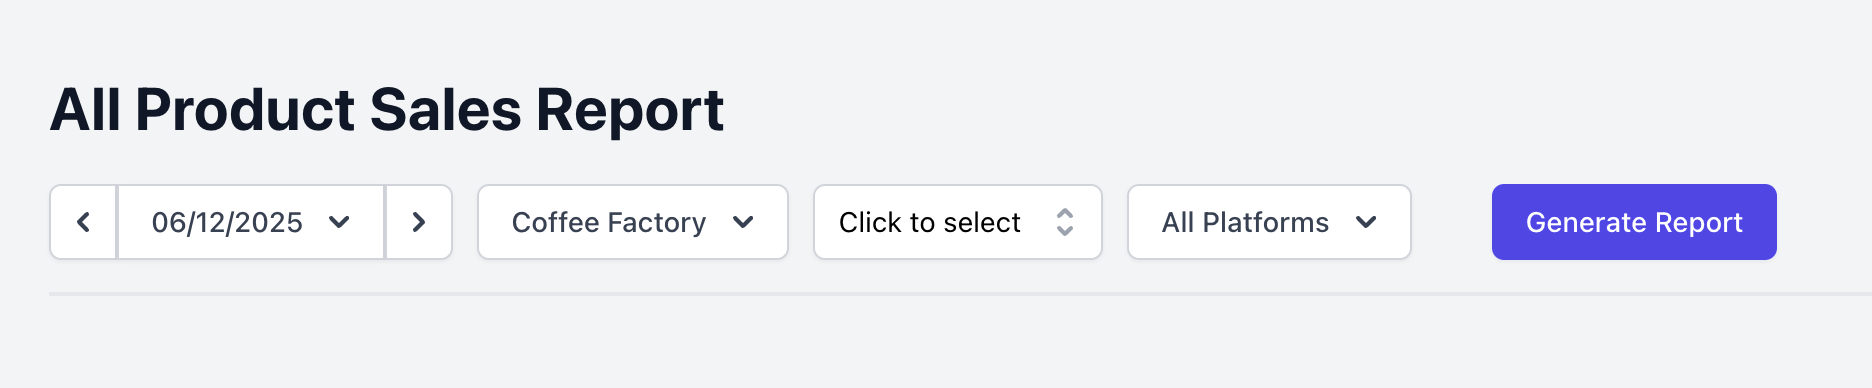
Date and Time
Location
If your company has multiple locations, the report defaults to the one you’re logged into. You can select any locations you have access to.
Product Tags
Product tags are created and added to products from the *Dashboard. Learn how to add tags to a product here.
Exclude Third Party Orders
This will only appear if you have a third party integration with Dripos 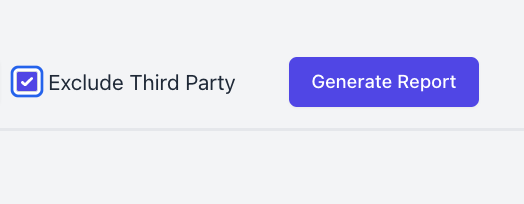
Category Sales
The Category Sales Report provides a breakdown of sales for each of your menu categories during the selected time period. Access the Category Sales Report from the Dashboard, Point of Sale, and Hub App.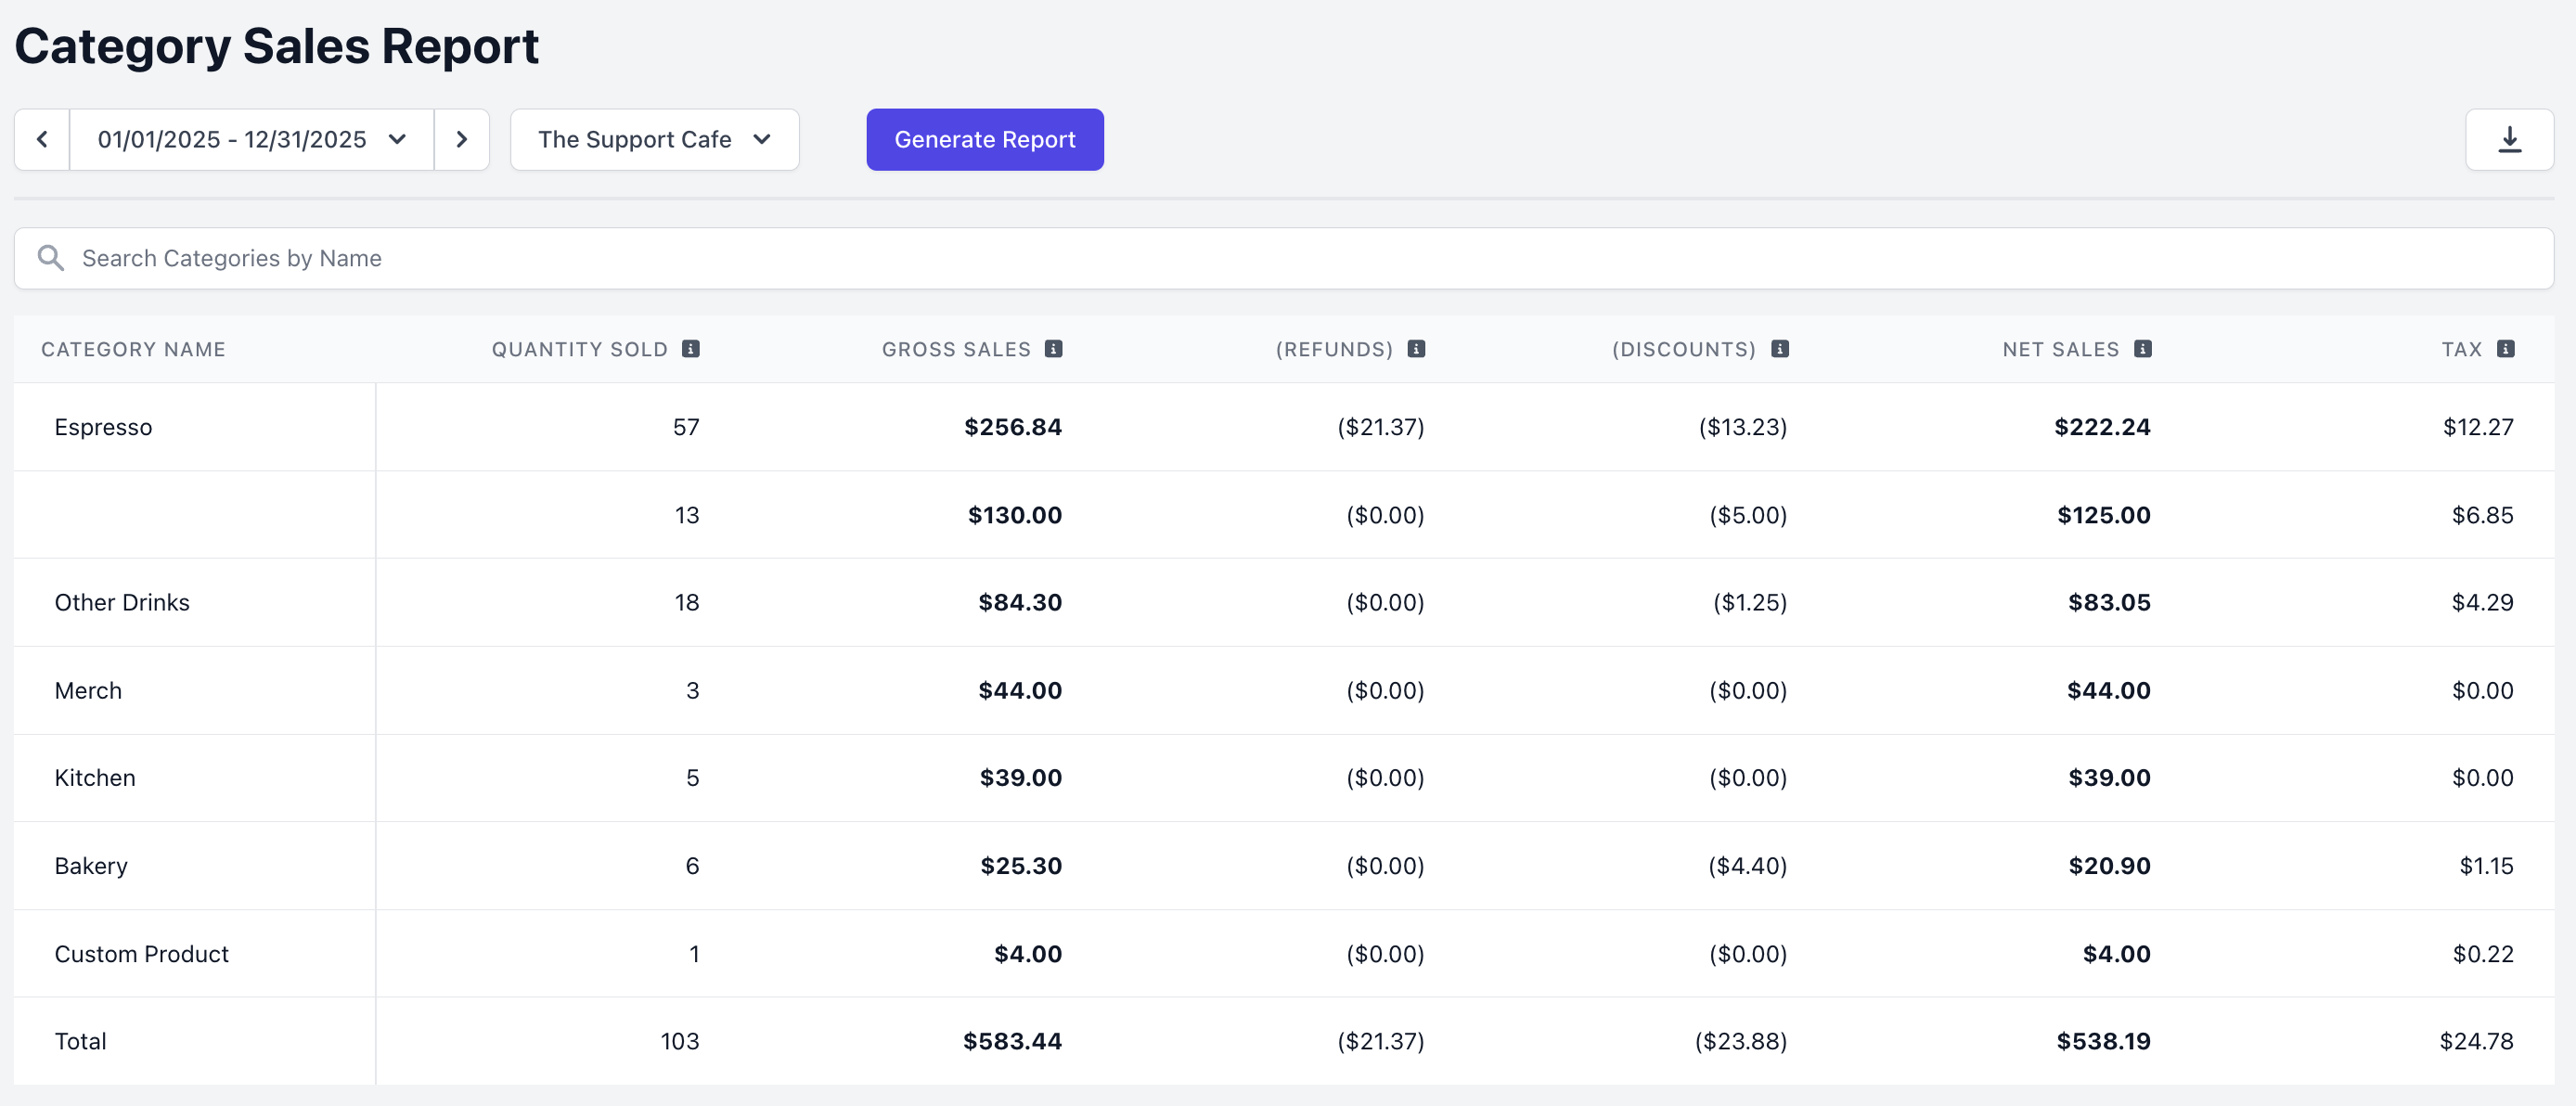
Report Line Items
Report Line Items
Time Period: Designate a time period for the reportLocation: For multi-location shops, select the desired location(s) to show category sales for.Category Name: The name of the menu category.Quantity Sold: The total quantity sold from the category.Gross Sales: The total sales collected from the category, including sales that were refunded and discounted. This number does not include category taxes collected.Refunds: The total amount that was refunded from sales under the category.Discounts: The total amount that was discounted from sales under the category.Net Sales: The total amount of sales collected during the selected time period.Tax: The taxes collected from net category sales.
Discounts
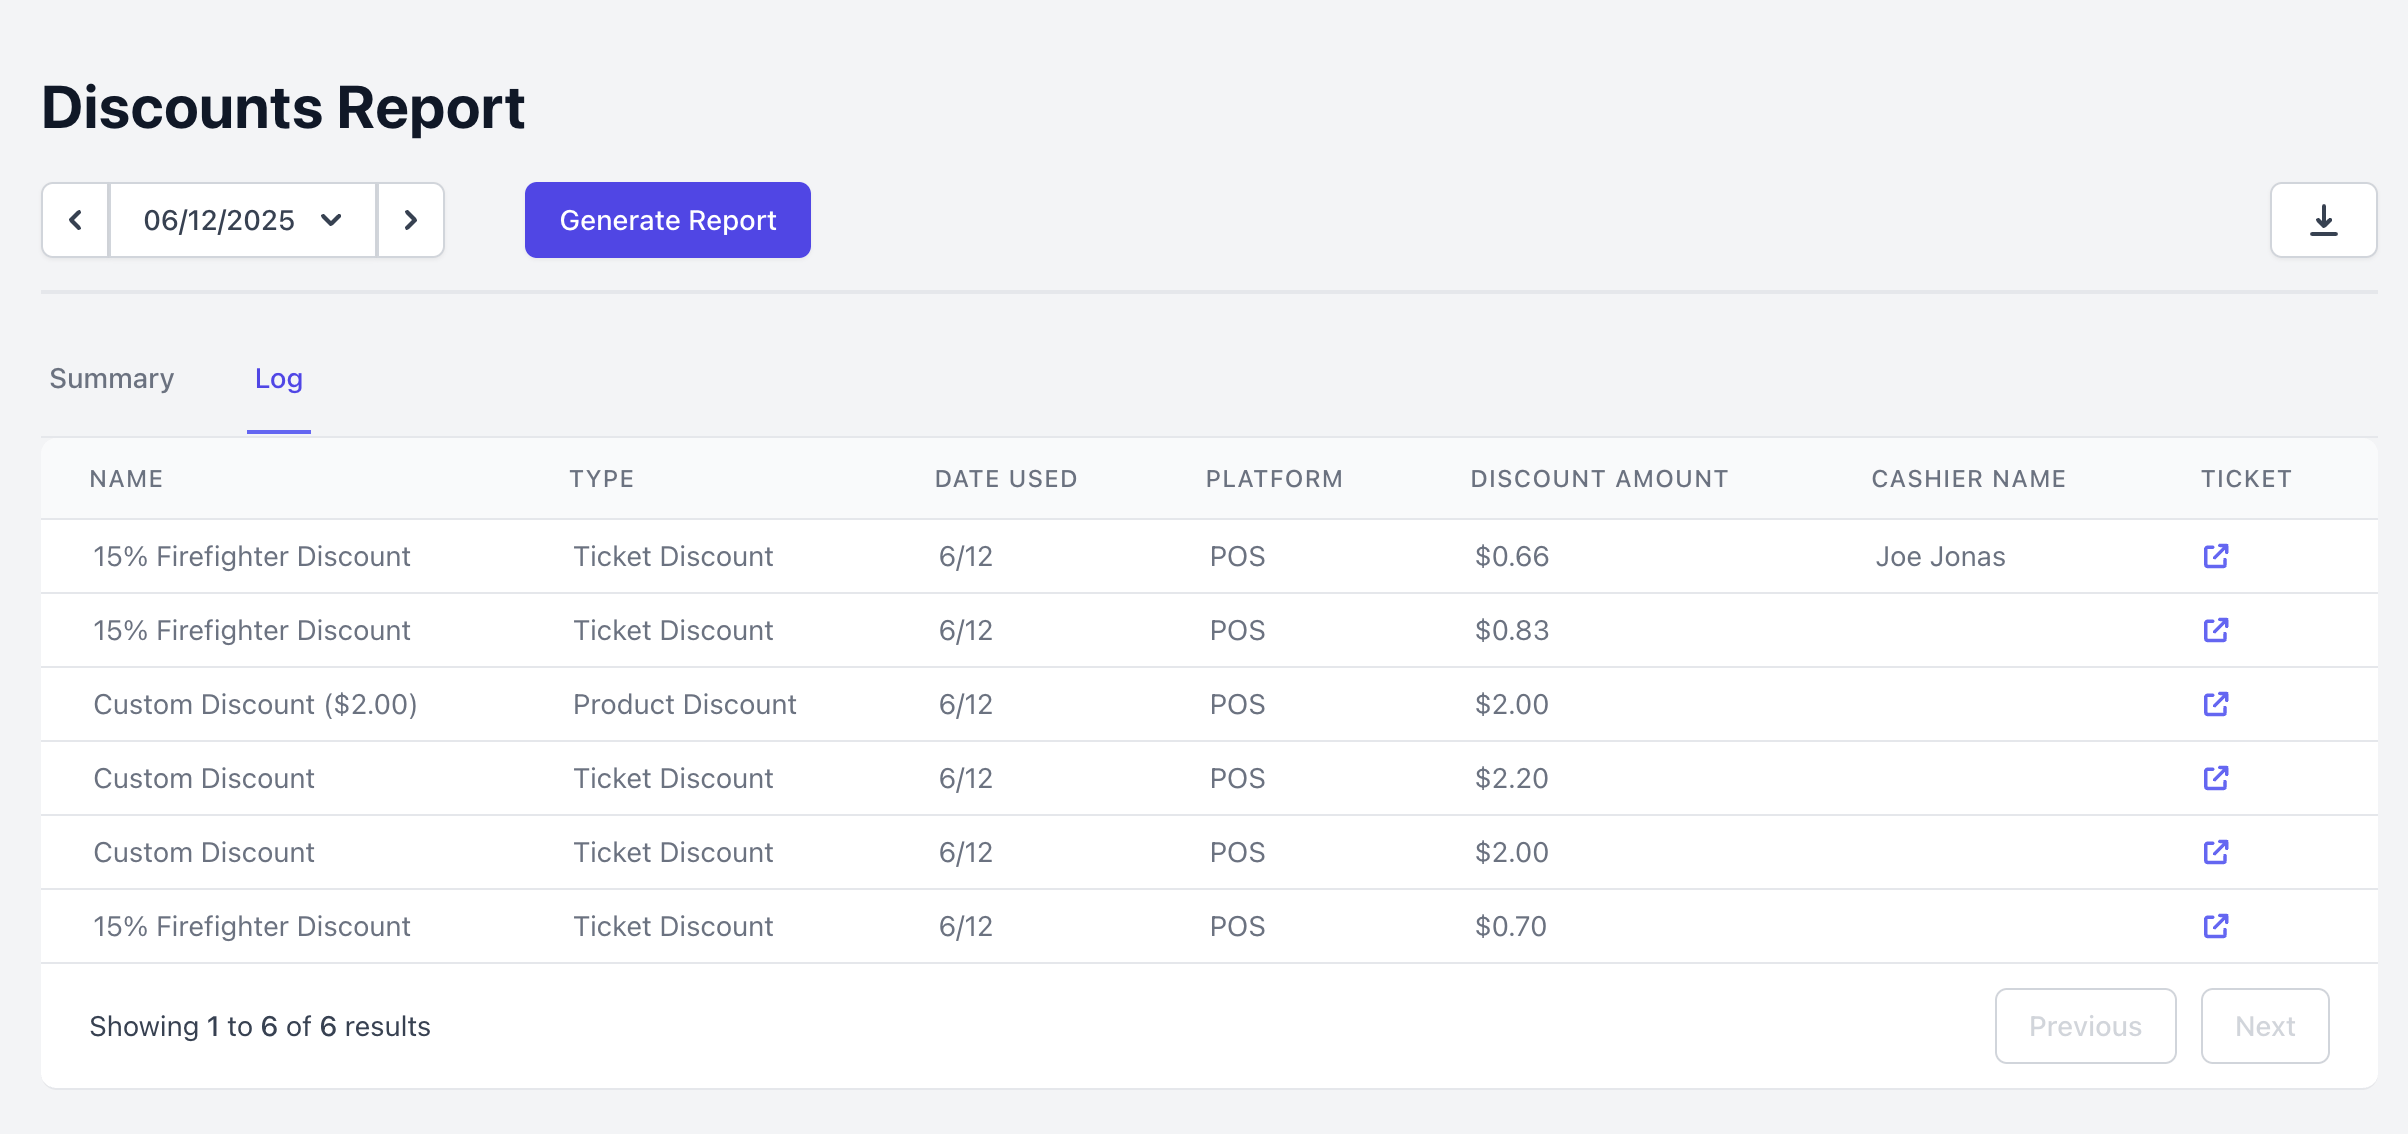
The Discounts Report provides an overview of any discounts that were applied to orders during your selected time period. Access your shop’s Discounts Report at any time from the Dashboard, Point of Sale, and Hub App.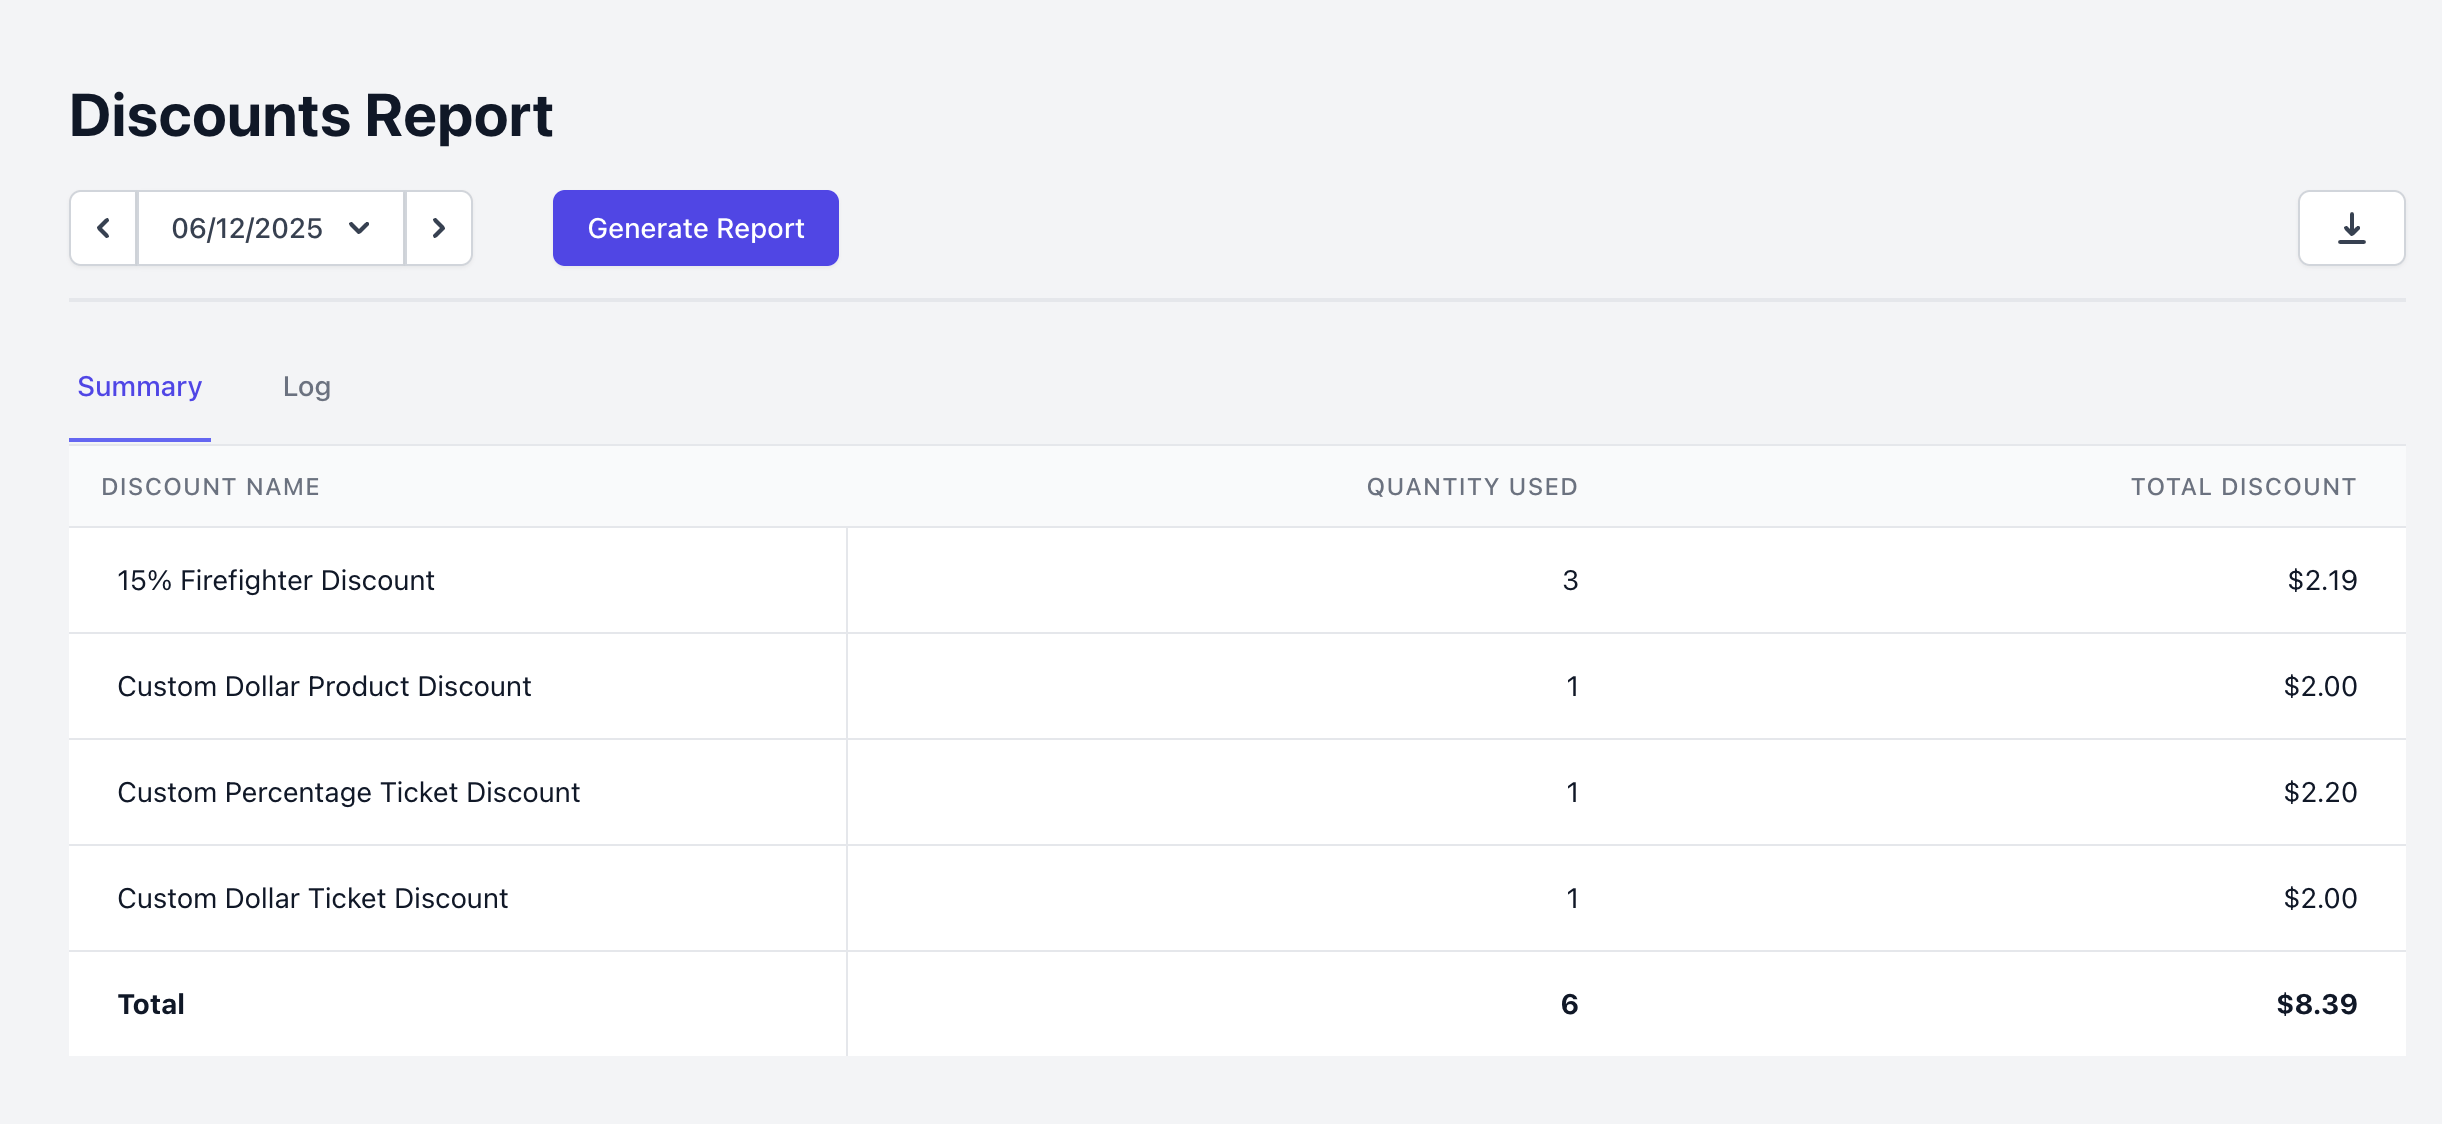
Report Line Items
Report Line Items
Discount Name: The name of the discount that was applied to a product or ticket during your selected periodQuantity Used: The amount of times that discount was applied to orders during your selected time periodTotal Discount: The total amount that was deducted from sales after the discount was applied
Labor vs Sales
The Labor vs Sales Report breaks down your labor cost against sales hour by hour, so you can see how efficiently you’re staffed throughout the day.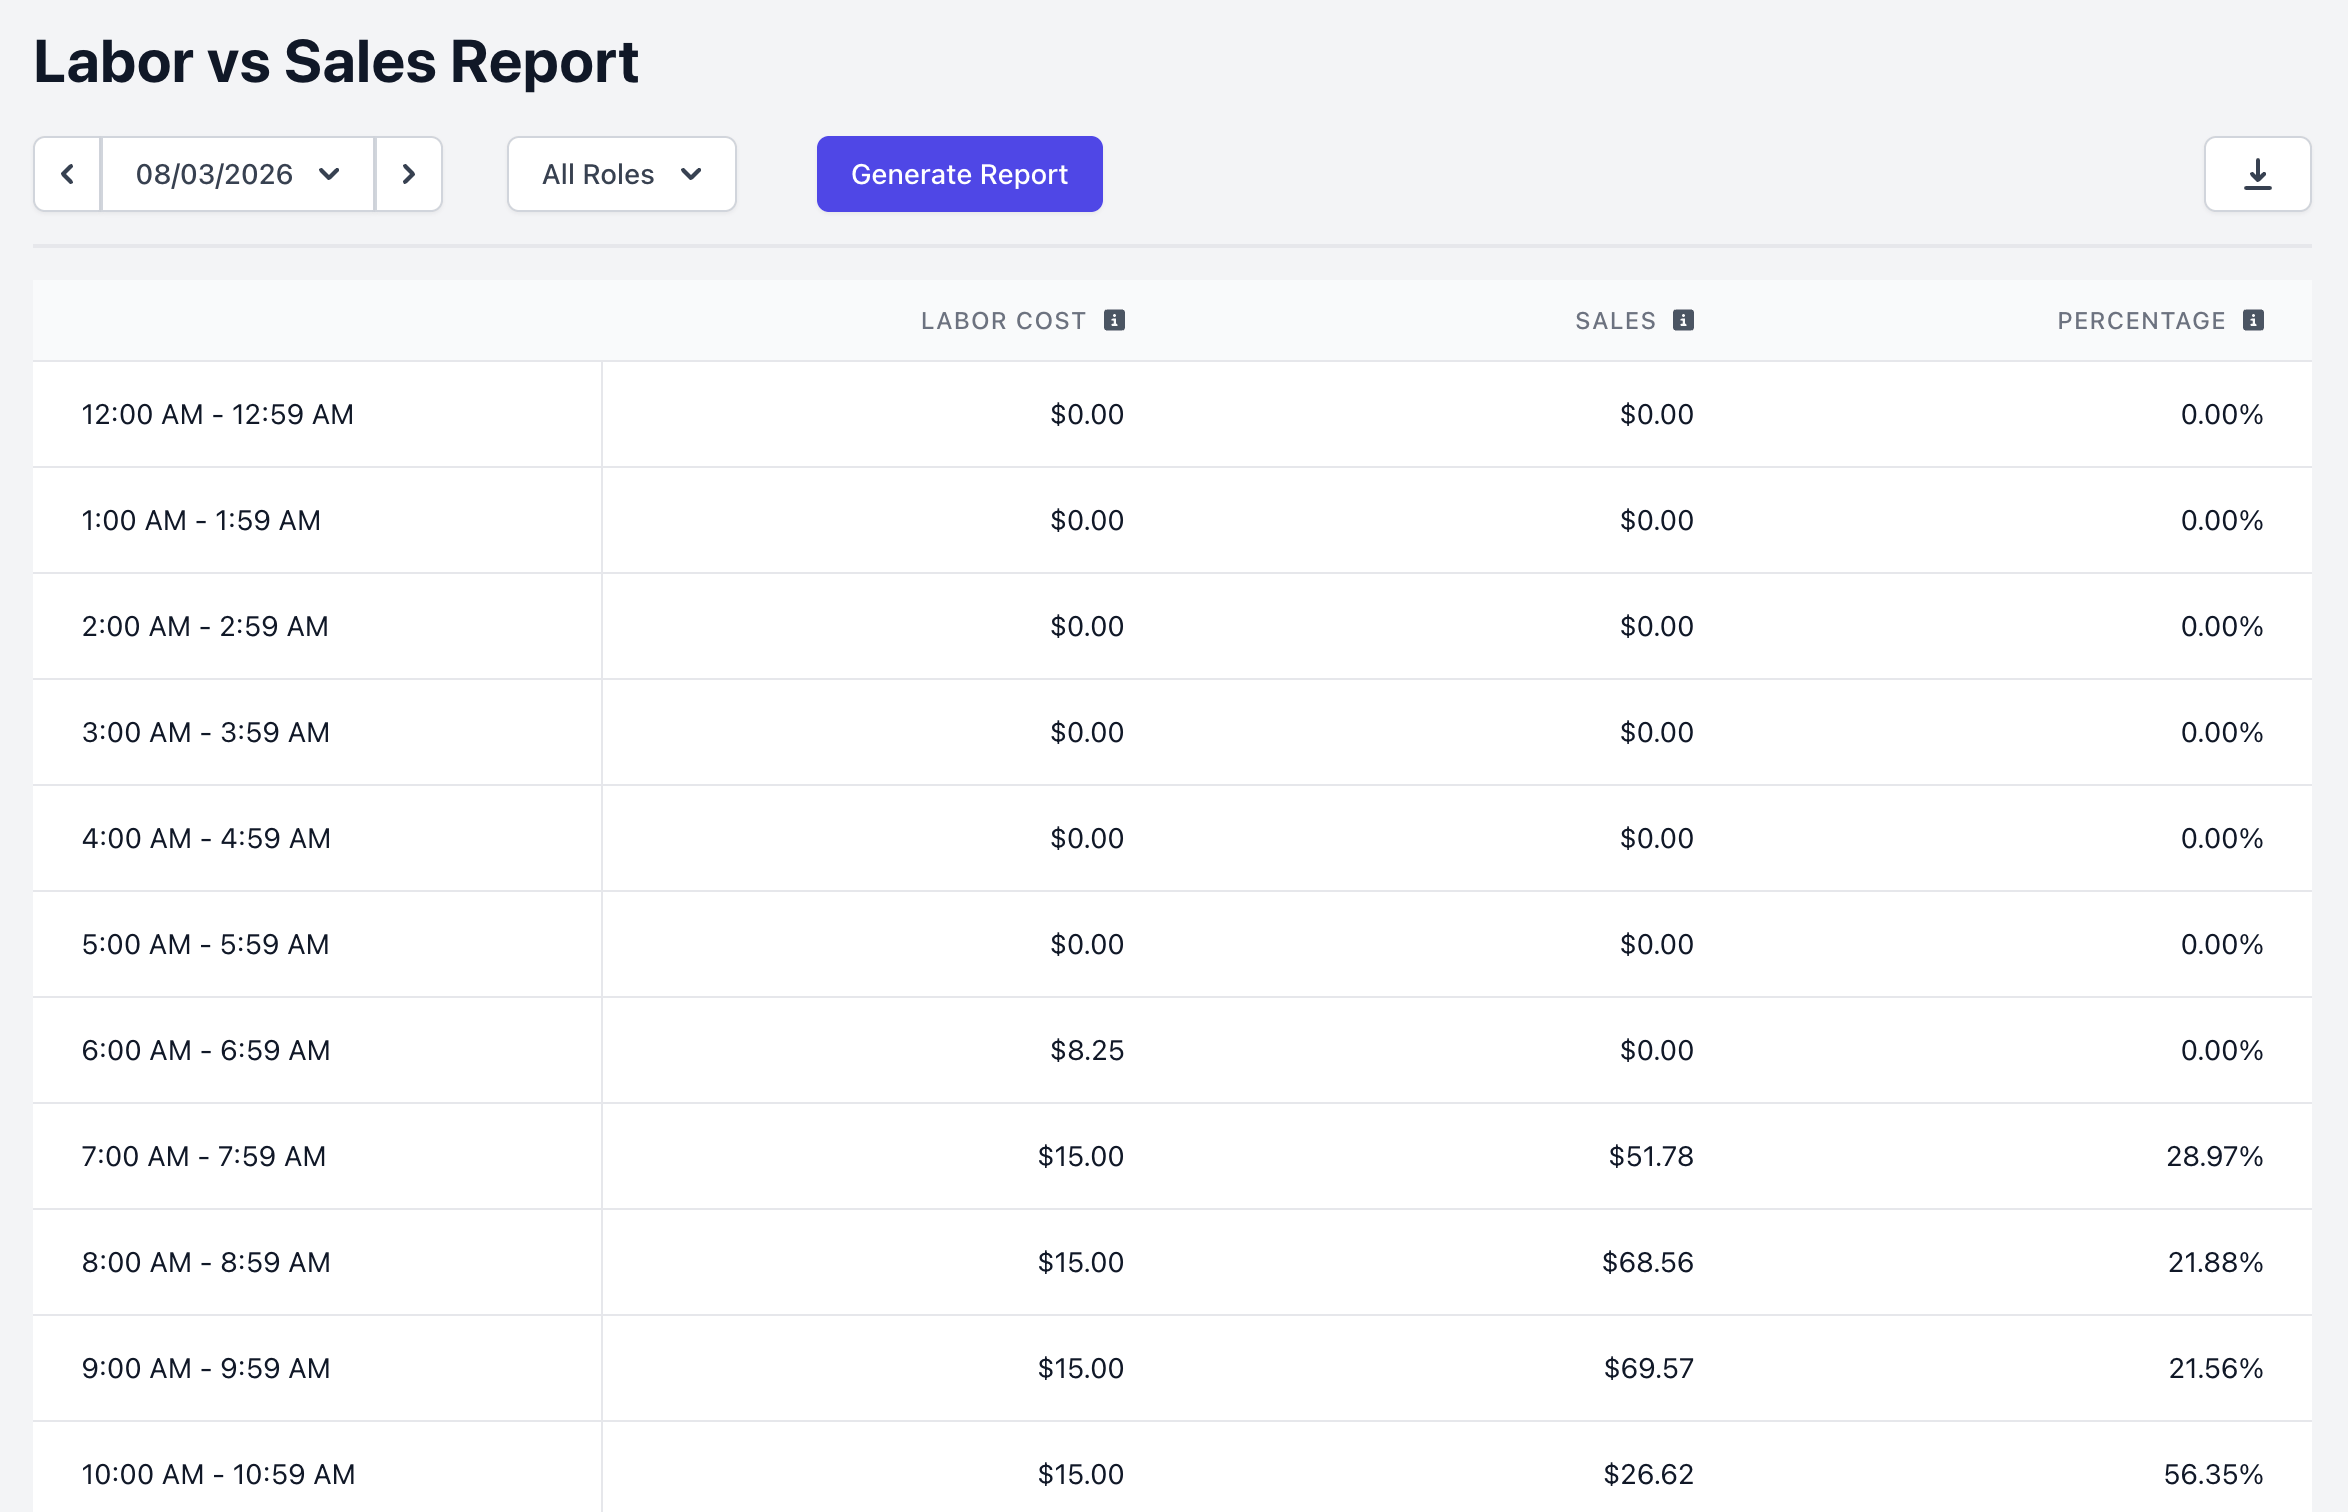
Report Line Items
Report Line Items
Labor Cost: Total labor cost calculated from employees’ time cards during the corresponding hour. If a shift spans multiple hours, wages are prorated across each hour worked.Sales: Total gross sales collected during the corresponding hourPercentage: Labor cost as a percentage of sales for the corresponding hour
Modifier Sales
The Modifier Sales Report provides a detailed breakdown of sales attributed to each modifier and its individual options within a selected time period. View the report on the Dashboard, Point of Sale, and Hub App.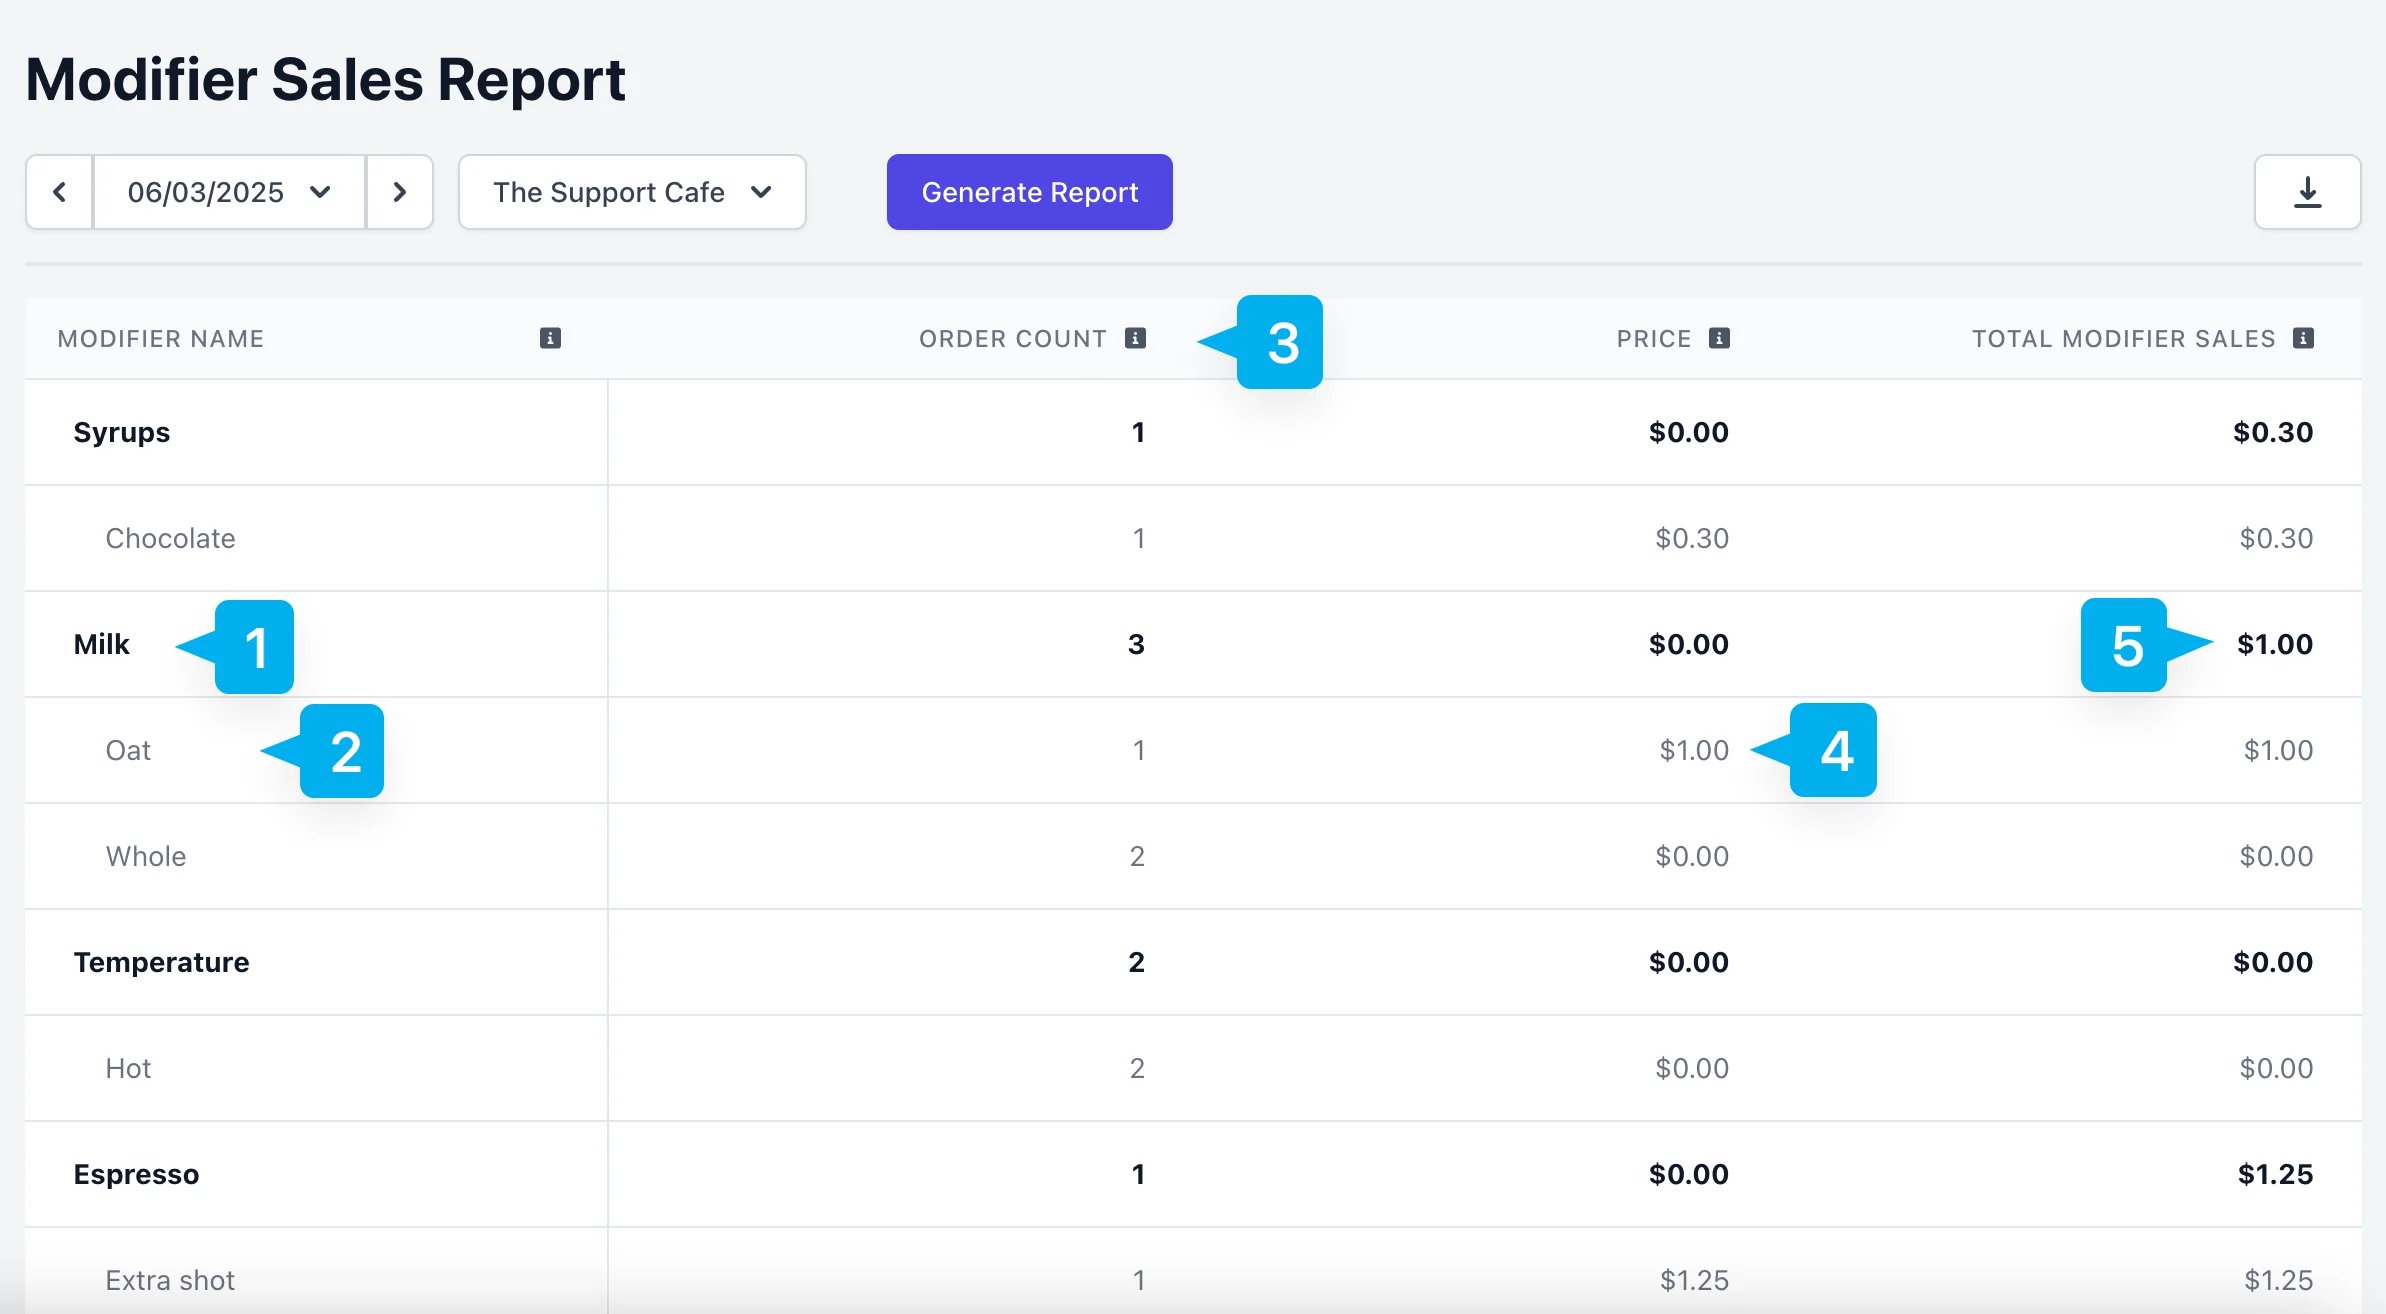
Report Line Items
Report Line Items
1 - Modifier Type: The modifier group name (i.e., Syrups, Milk, Breads). Only modifiers with sales during the selected time range will appear.2 - Modifier Option: The specific modifier option (i.e., vanilla syrup, whole milk, sourdough). Only modifiers with sales during the selected time range will appear.3 - Order Count: Shows the total number of modifier types and individual options sold during the selected time period.4 - Price per Modifier Option: Price per modifier Option sold. Modifier Type lines will always show $0.5 - Total Modifier Sales: Displays the total sales amount for all modifier options, grouped by each modifier type.
Platform Sales
View sales by each ordering platform. Click the Point of Sale dropdown to see sales by specific devices. View the report on the Dashboard, Point of Sale, and Hub App.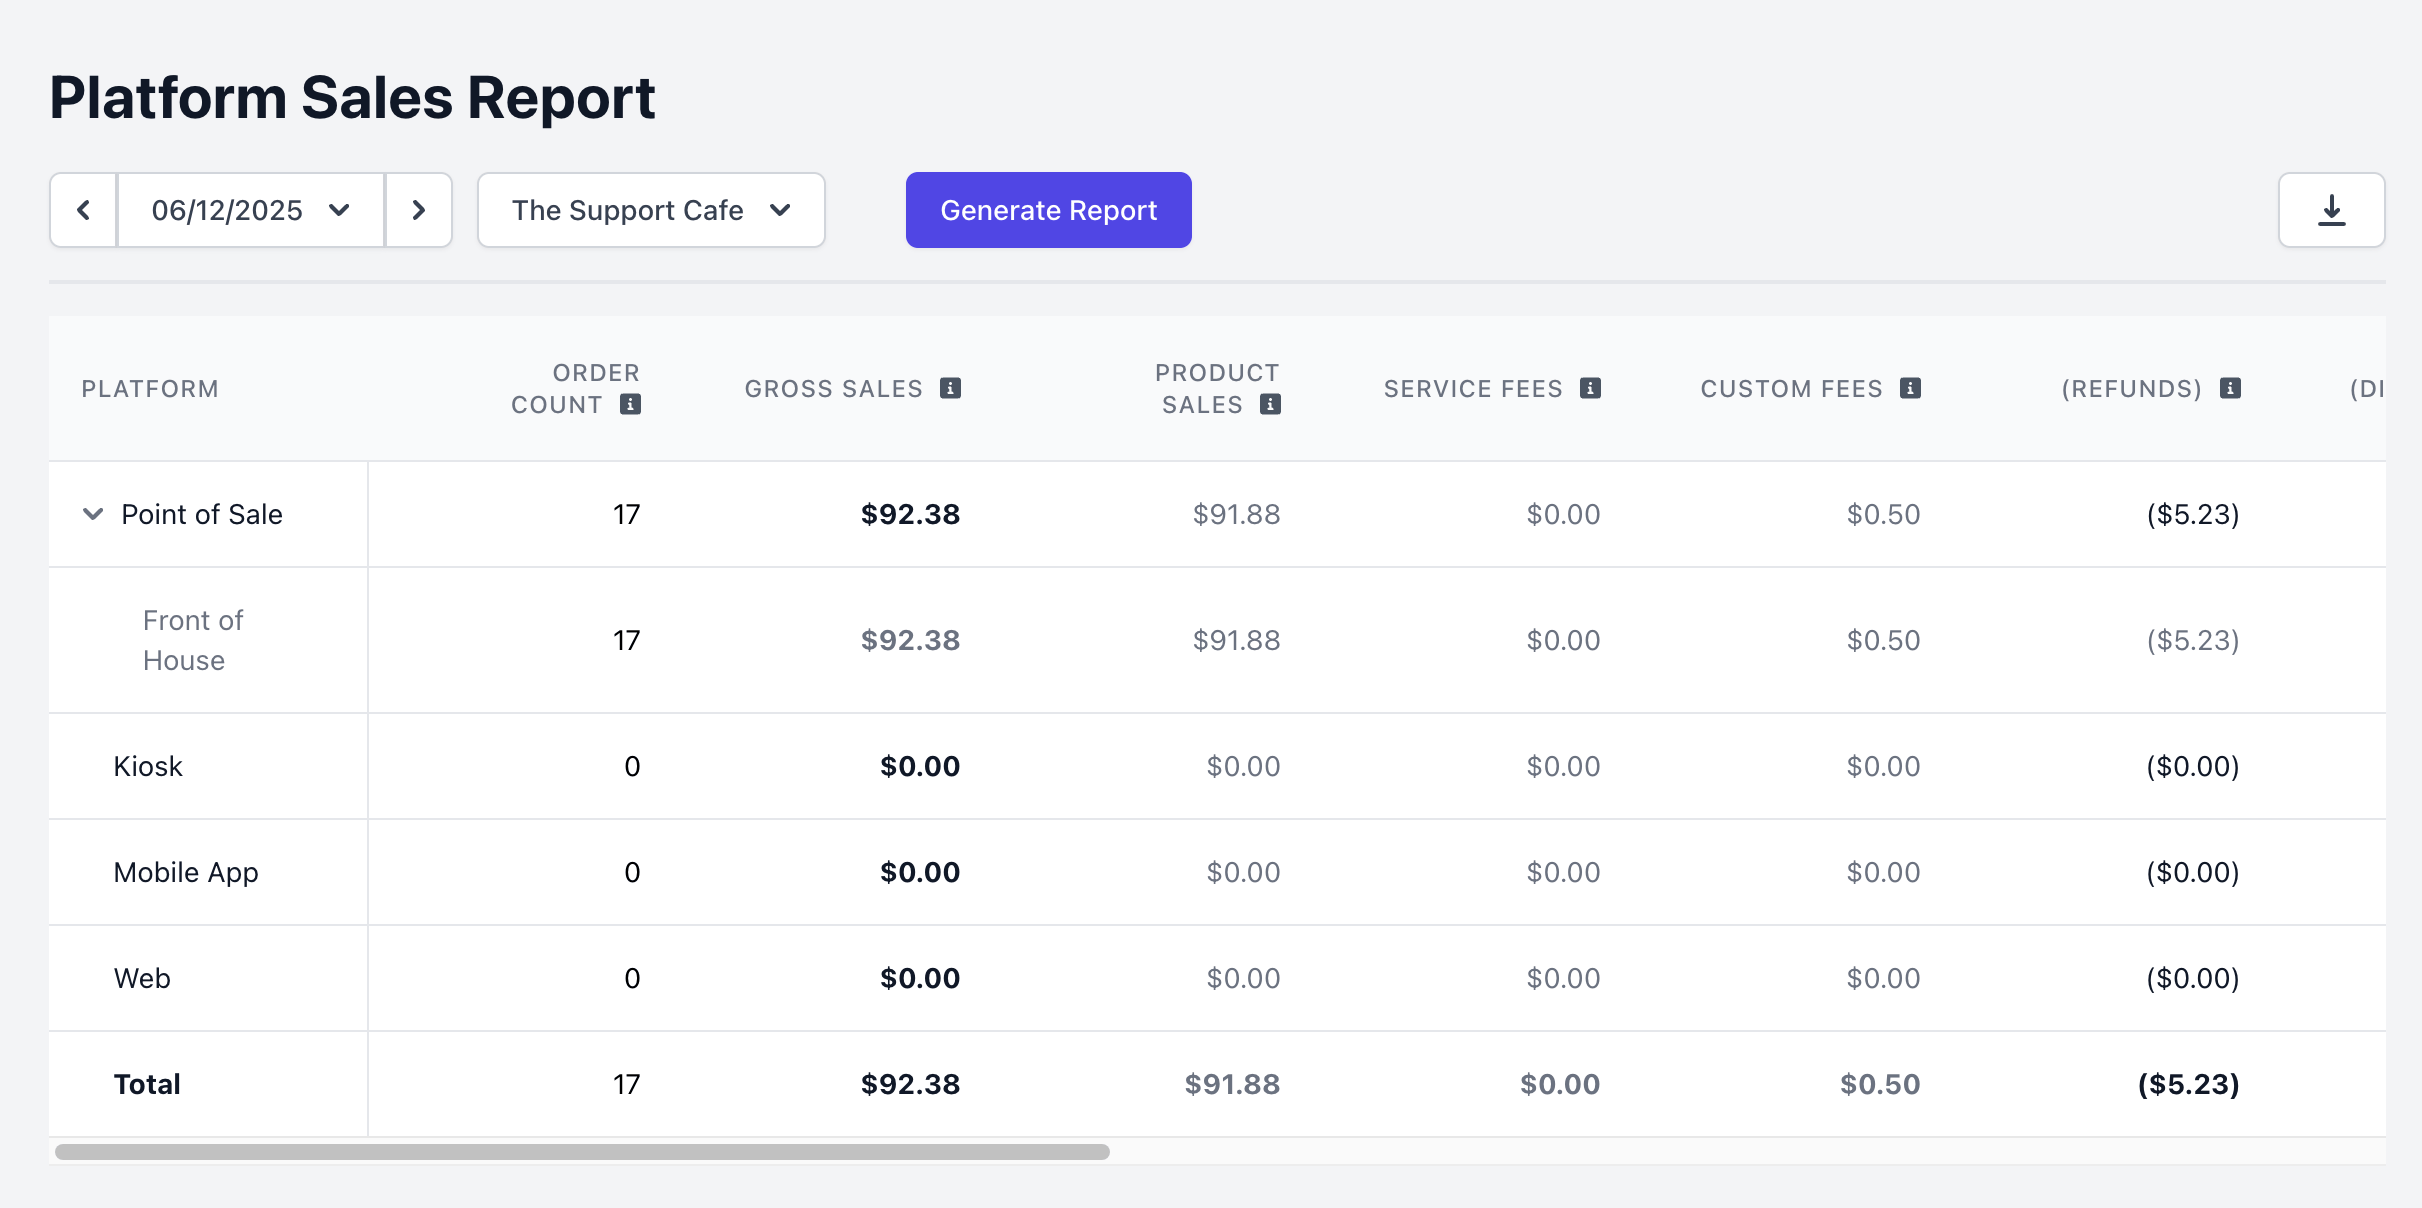
Report Line Items
Report Line Items
Order Count: Amount of orders placed through the corresponding ordering platformGross Sales: Total amount of product sales + custom fees collected from orders placed through the corresponding ordering platformProduct Sales: Total amount of sales collected from orders placed through the corresponding ordering platform, excluding services fees, refunds, taxes and discountsService Fees: Total amount of service fees collected on the corresponding ordering platform from customersCustom Fees: Total amount of custom fees collected on the corresponding ordering platformRefunds: Total amount that was refunded from sales made through the corresponding ordering platformDiscounts: Total amount of discounts applied sales placed through the corresponding ordering platformNet Sales: Product Sales - Custom Fees - Refunds - DiscountsCard Tips: Total amount of card tips collectedTax: Total amount of taxable sales collected from purchases madeGift Card Sales Total amount of gift cards soldTotal Sales: Net Sales + Card Tips + Tax + Gift Card SalesProcessing: Total sum of fees accumulated from card payments, both present and not present, as well as the payout feeNet Total: Total Sales - Processing
Ticket Type Sales
The Ticket Type Sales Report provides a detailed breakdown of sales attributed to each ticket type within a selected time period. View the report on the Dashboard, Point of Sale, and Hub App.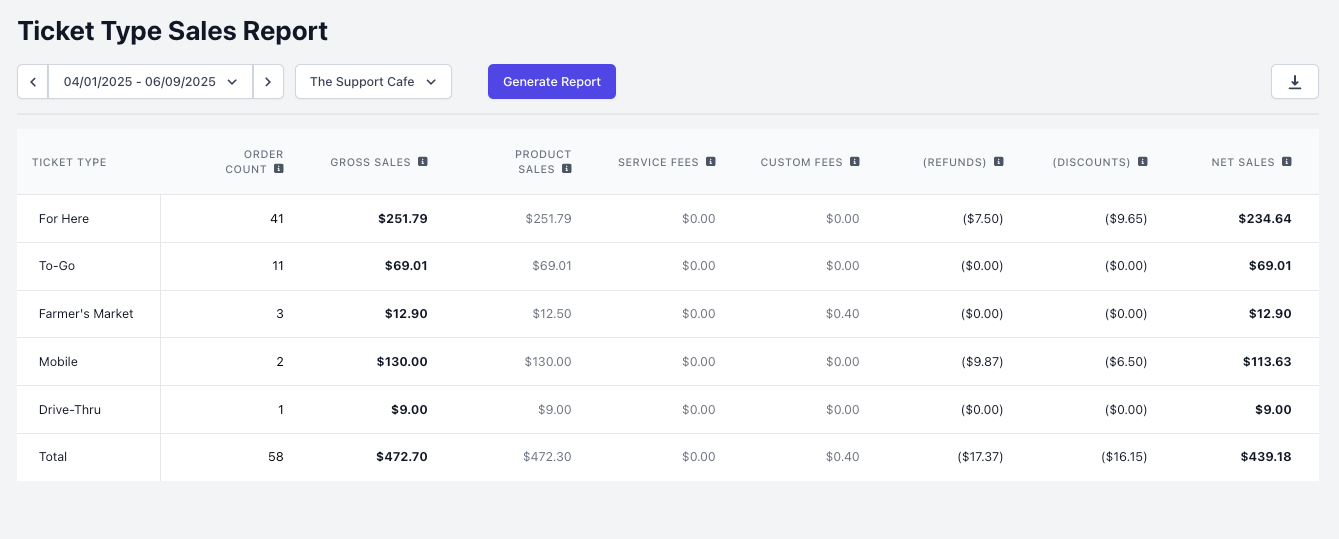
Report Line Items
Report Line Items
Ticket Type: Shows the ticket types. *Only ticket types with sales during the selected time range will appear.Order Count: Shows the total number of orders placed through the corresponding ticket types within the selected time period.Gross Sales: The total amount of sales collected from orders placed through the corresponding ticket type, excluding taxes, services fees, custom fees, refunds, and/or discounts.Product Sales: The total amount of sales collected from orders placed through the corresponding ticket type, including services fees, custom fees, and/or discounts.
Service Fees: The total amount of fees collected from orders placed through the corresponding ticket type, from customers through service fees and delivery fees.Custom Fees: The total amount of fees collected on the corresponding ticket type from customers through shop custom fees.Refunds: The total amount that was refunded from sales made through the corresponding ticket type during your selected time period.Discounts: The total amount that was discounted from sales placed through the corresponding ticket type during your selected time period.Net Sales: The total amount of sales collected from the corresponding ticking type after accounting for refunds and discounts.
The value listed excludes taxes and refunds.
Taxable Sales
The Taxable Sales Report provides a breakdown of taxes collected on sales during the selected time period. Access the Taxable Sales Report from the Dashboard, Point of Sale, and Hub App.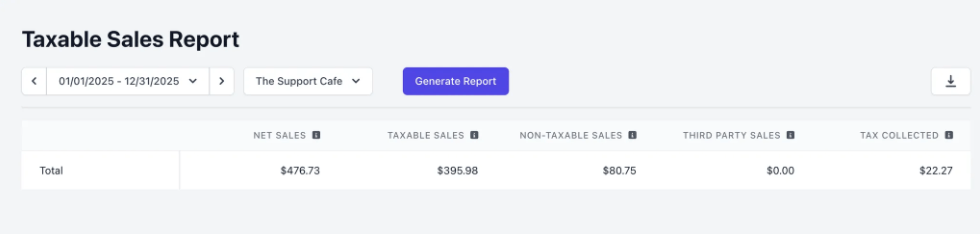
Report Line Items
Report Line Items
Time Period: Designate a time period for the reportLocation: For multi-location shops, select the desired location(s) to show taxable sales forNet Sales: The total amount of sales collected during the selected time periodTaxable Sales: The total amount of taxable sales collected during the selected time periodNon-Taxable Sales: The total amount of non-taxable sales collected during the selected time period, such as non-taxed and tax disabled product salesThird Party Sales: The total amount of sales collected through third-party orders placed during the selected time periodTax Collected: The total amount of taxes collected through taxable sales placed during the selected time period
Tax Categories
The Tax Categories Report provides a breakdown of the tax amounts collected under different tax rates. Access the Tax Categories Report from the Dashboard.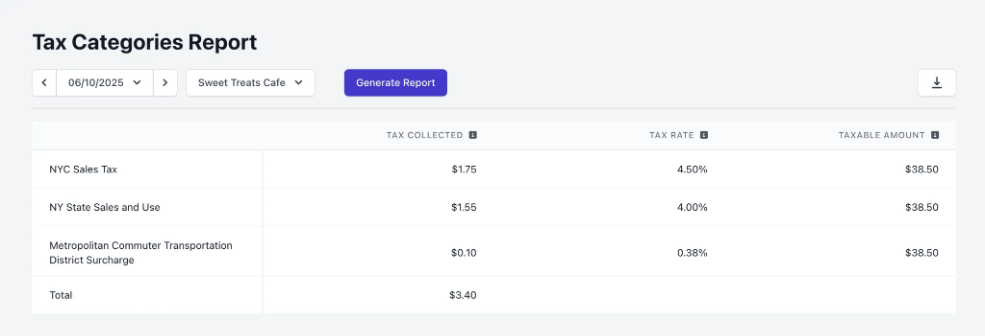
Report Line Items
Report Line Items
Time Period: Designate a time period for the reportLocation: For multi-location shops, select the desired location(s) to show the tax categories breakdown forTax Collected: The amount of tax collected using this tax rateTax Rate: The rate for this tax rateTaxable Amount: The amount of sales taxable using this tax rate
Time Cards
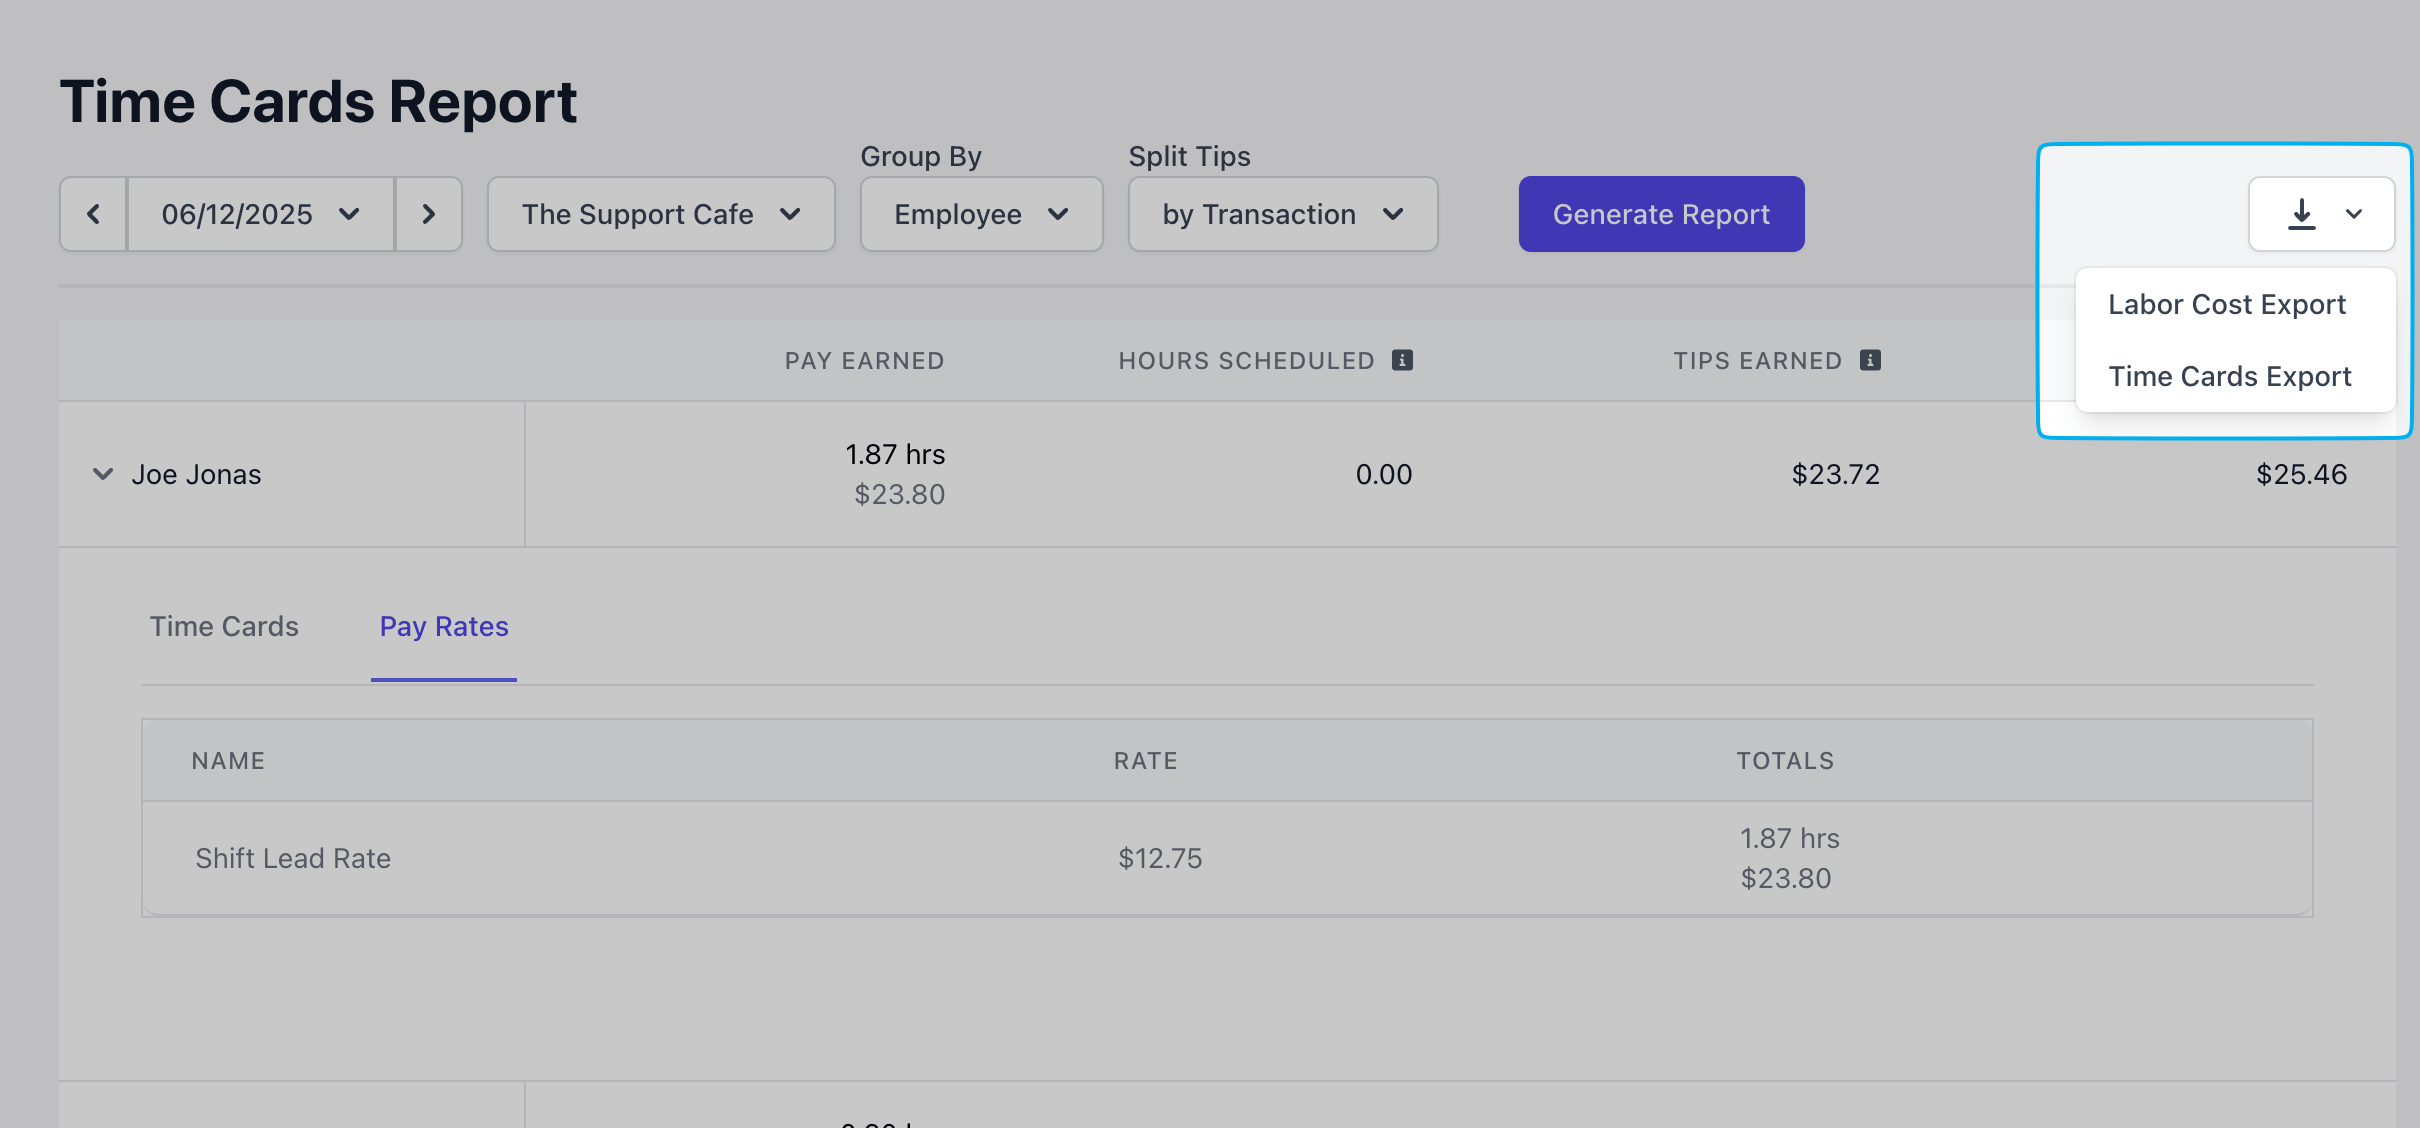
The Time Cards Report provides a breakdown of the total time worked by your employees as well as tips earned. Access this report from the Dashboard, Point of Sale, and Hub App.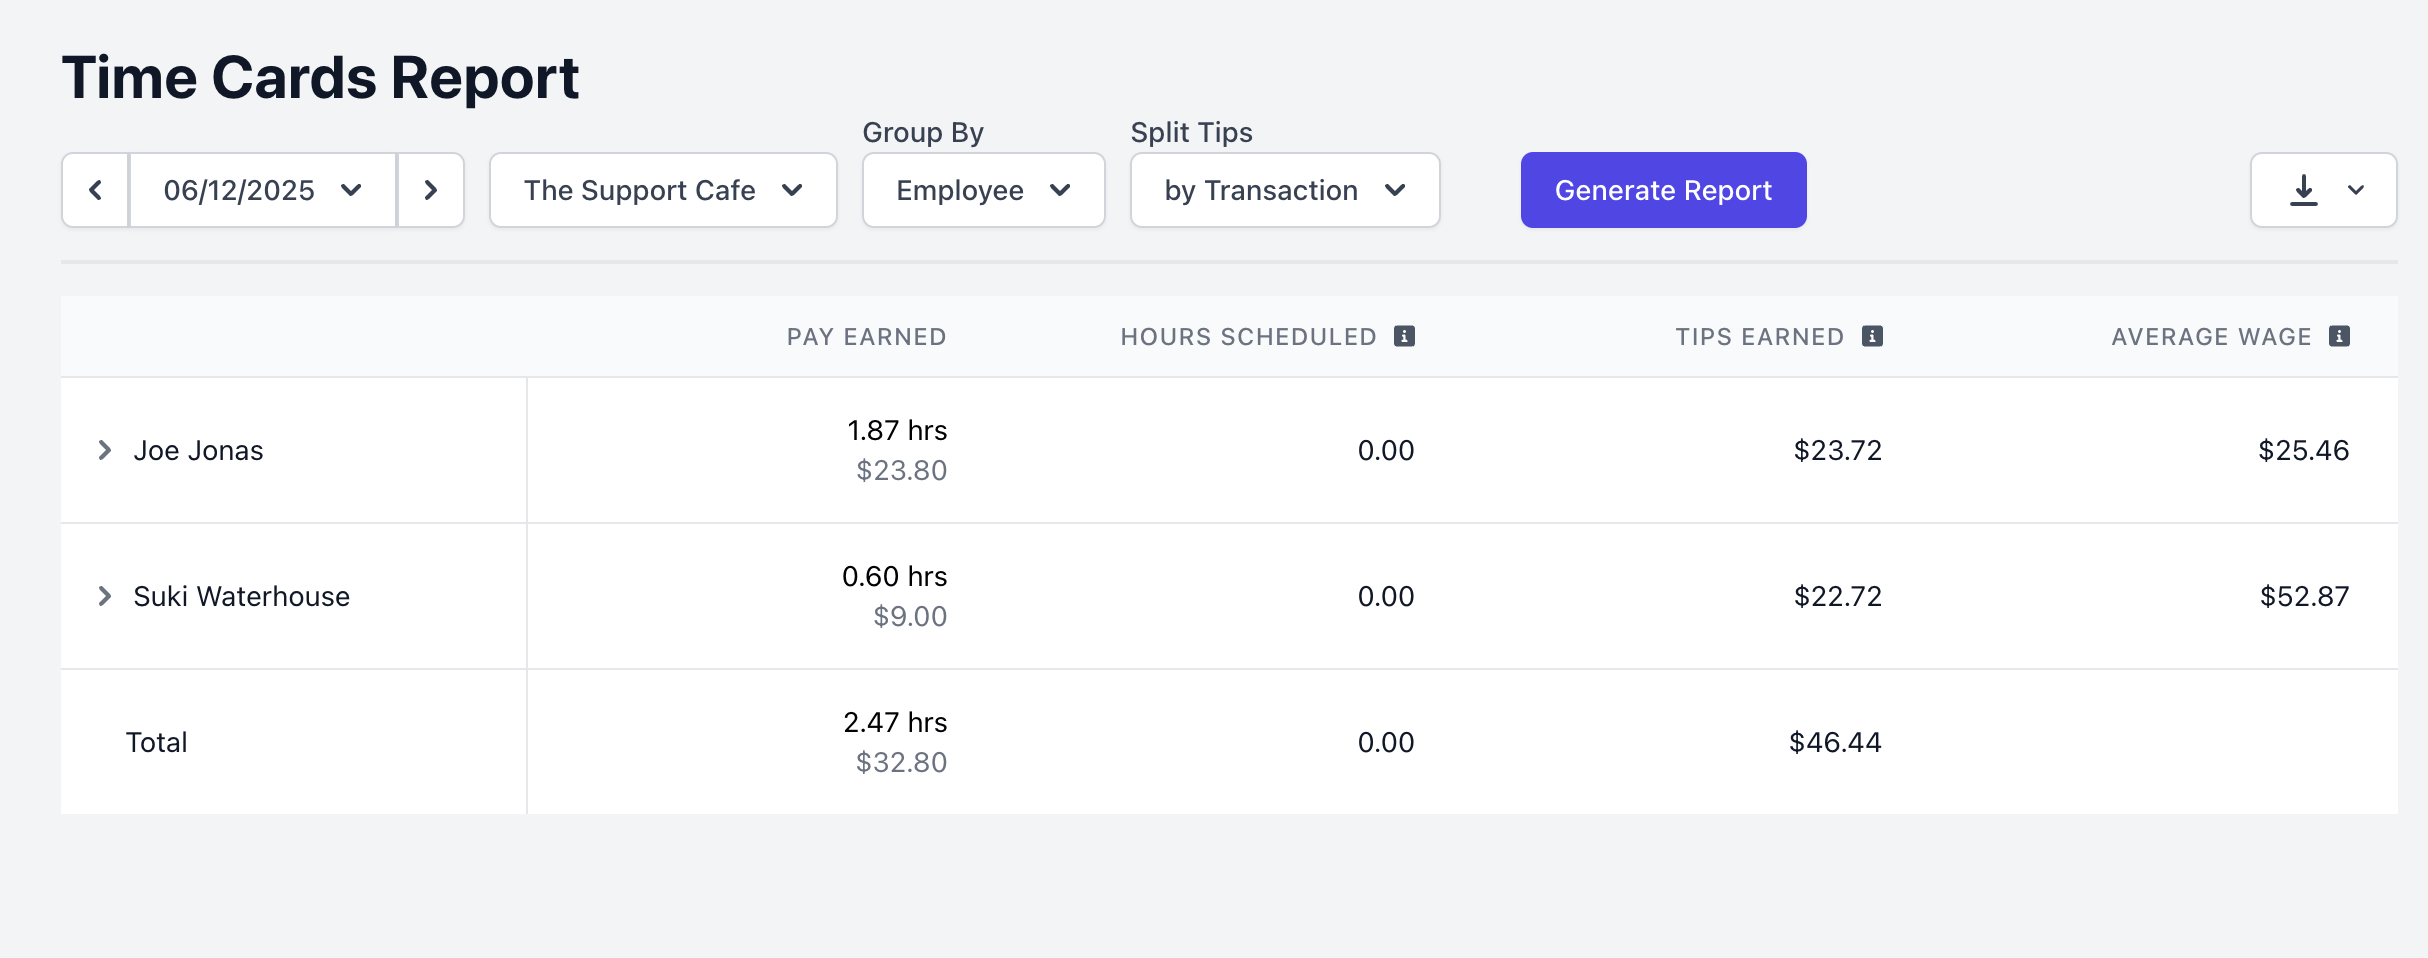
Report Line Items
Report Line Items
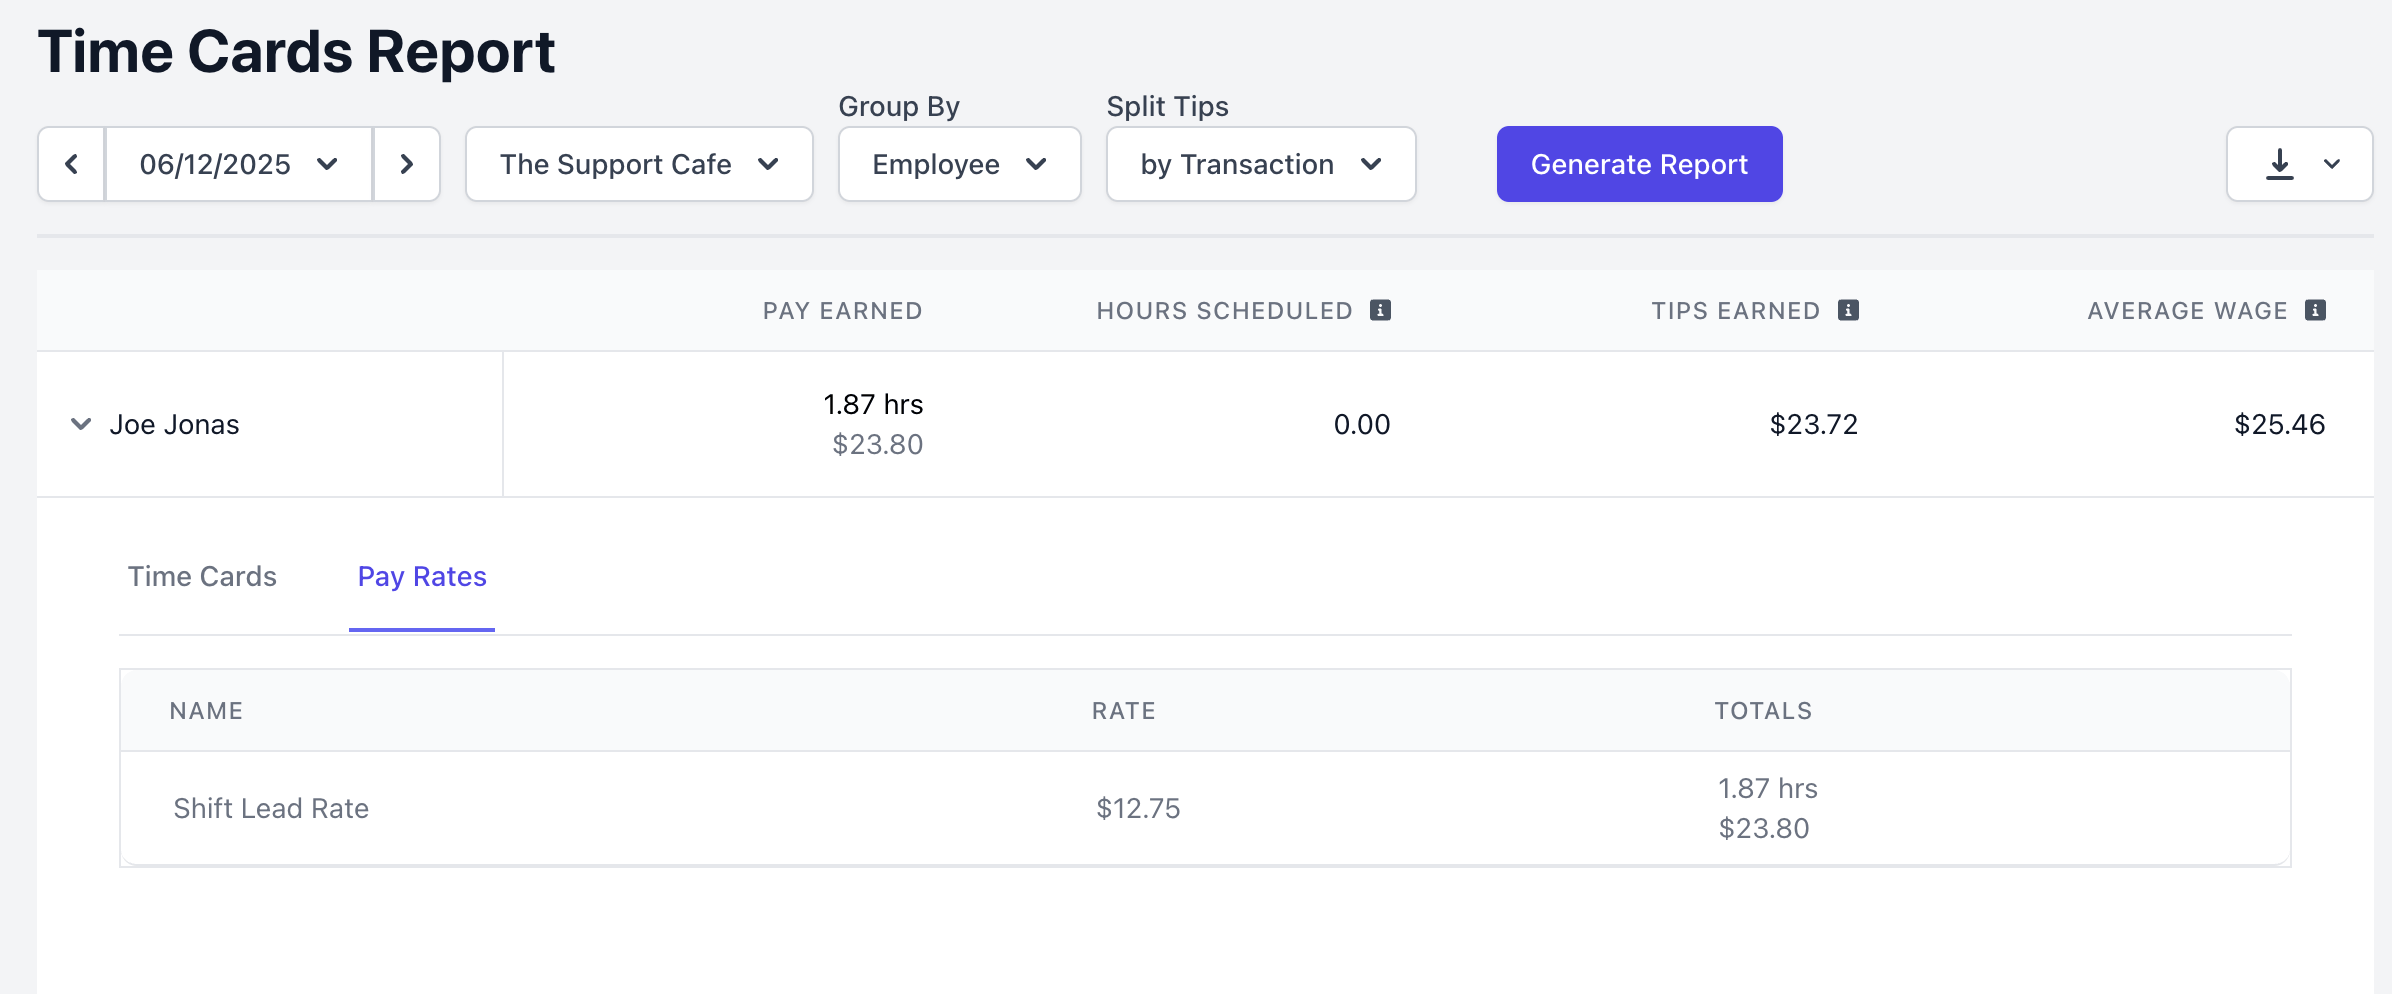
Pay Earned: Total pay earned (wage * hours worked), not including any overtime payOvertime: Pay earned from any overtime hours worked during the selected time periodHours Scheduled: Amount of hours the corresponding employee was scheudled for during the selected time periodTips Earned: Total amount of tips earned across all shifts during the selected time frameAverage Wage: The average hourly wage estimated the employee would earn based on the data presented (pay earned + tips earned / total hours worked)
View the tips as split by one of the following methods: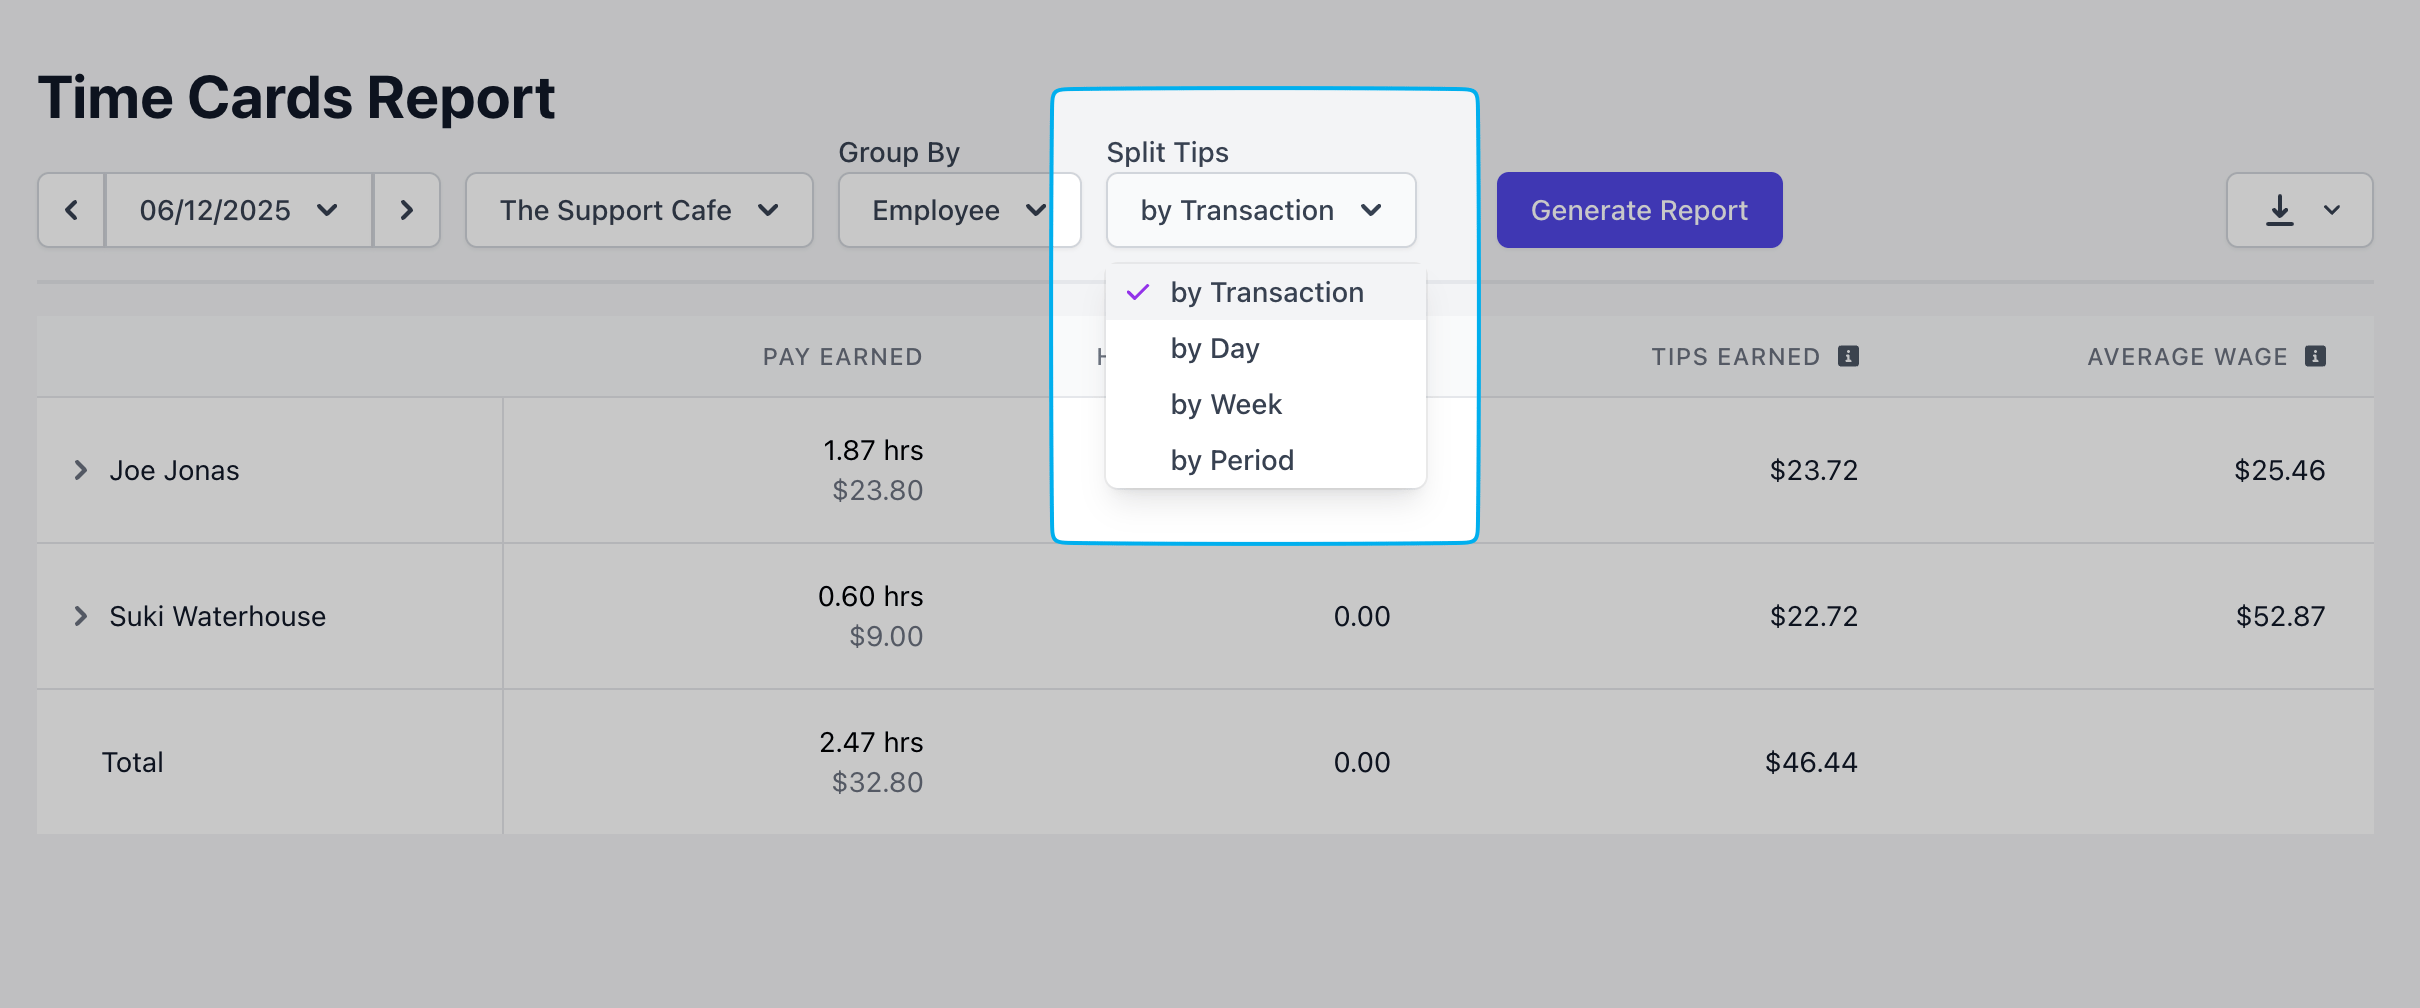
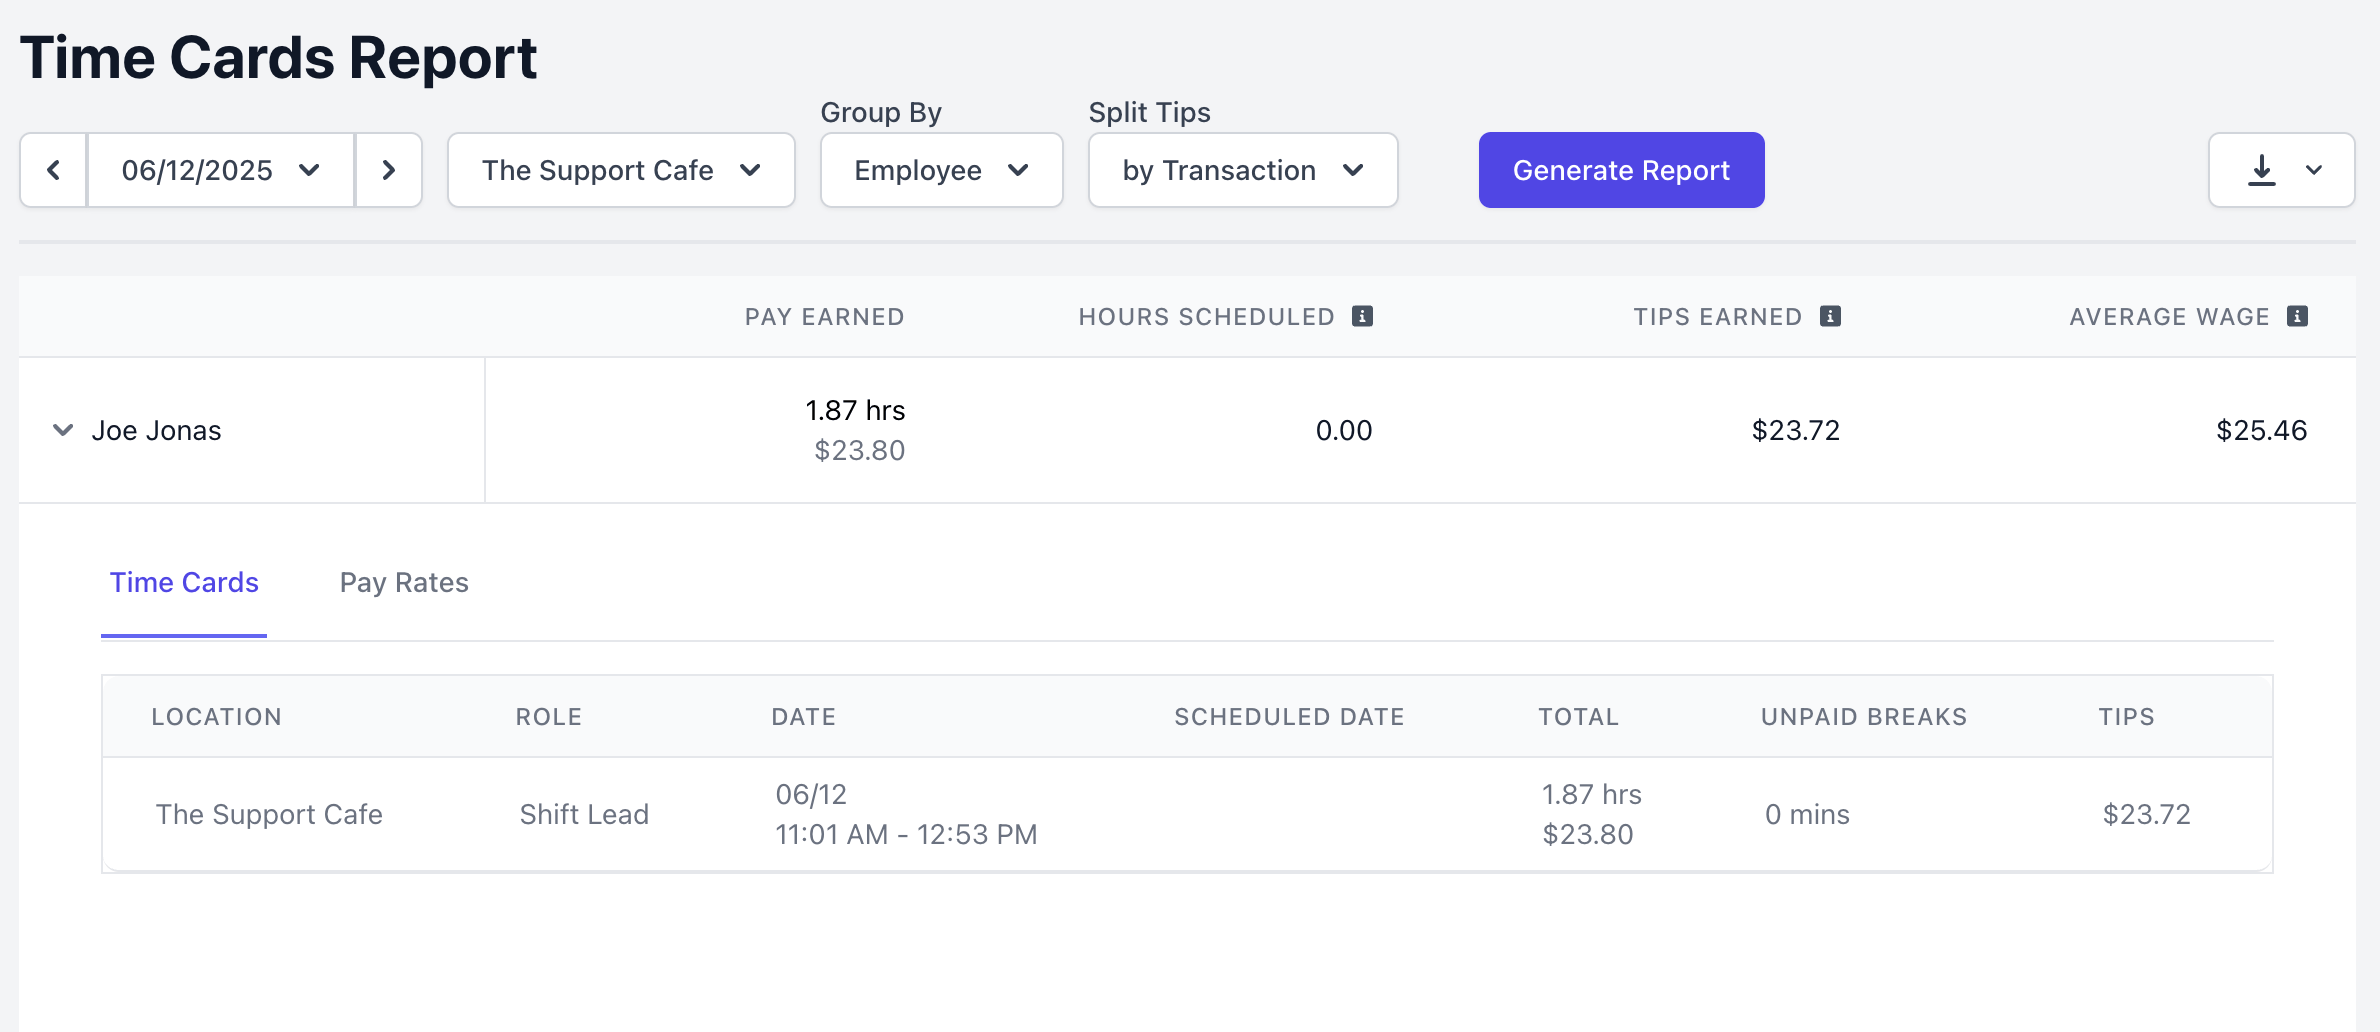
Click on the time card to make changes to the card.
Team Sales
The Team Sales Report breaks down which items were sold by employees that were clocked in during the selected time period. This report can only be accessed from the Dashboard.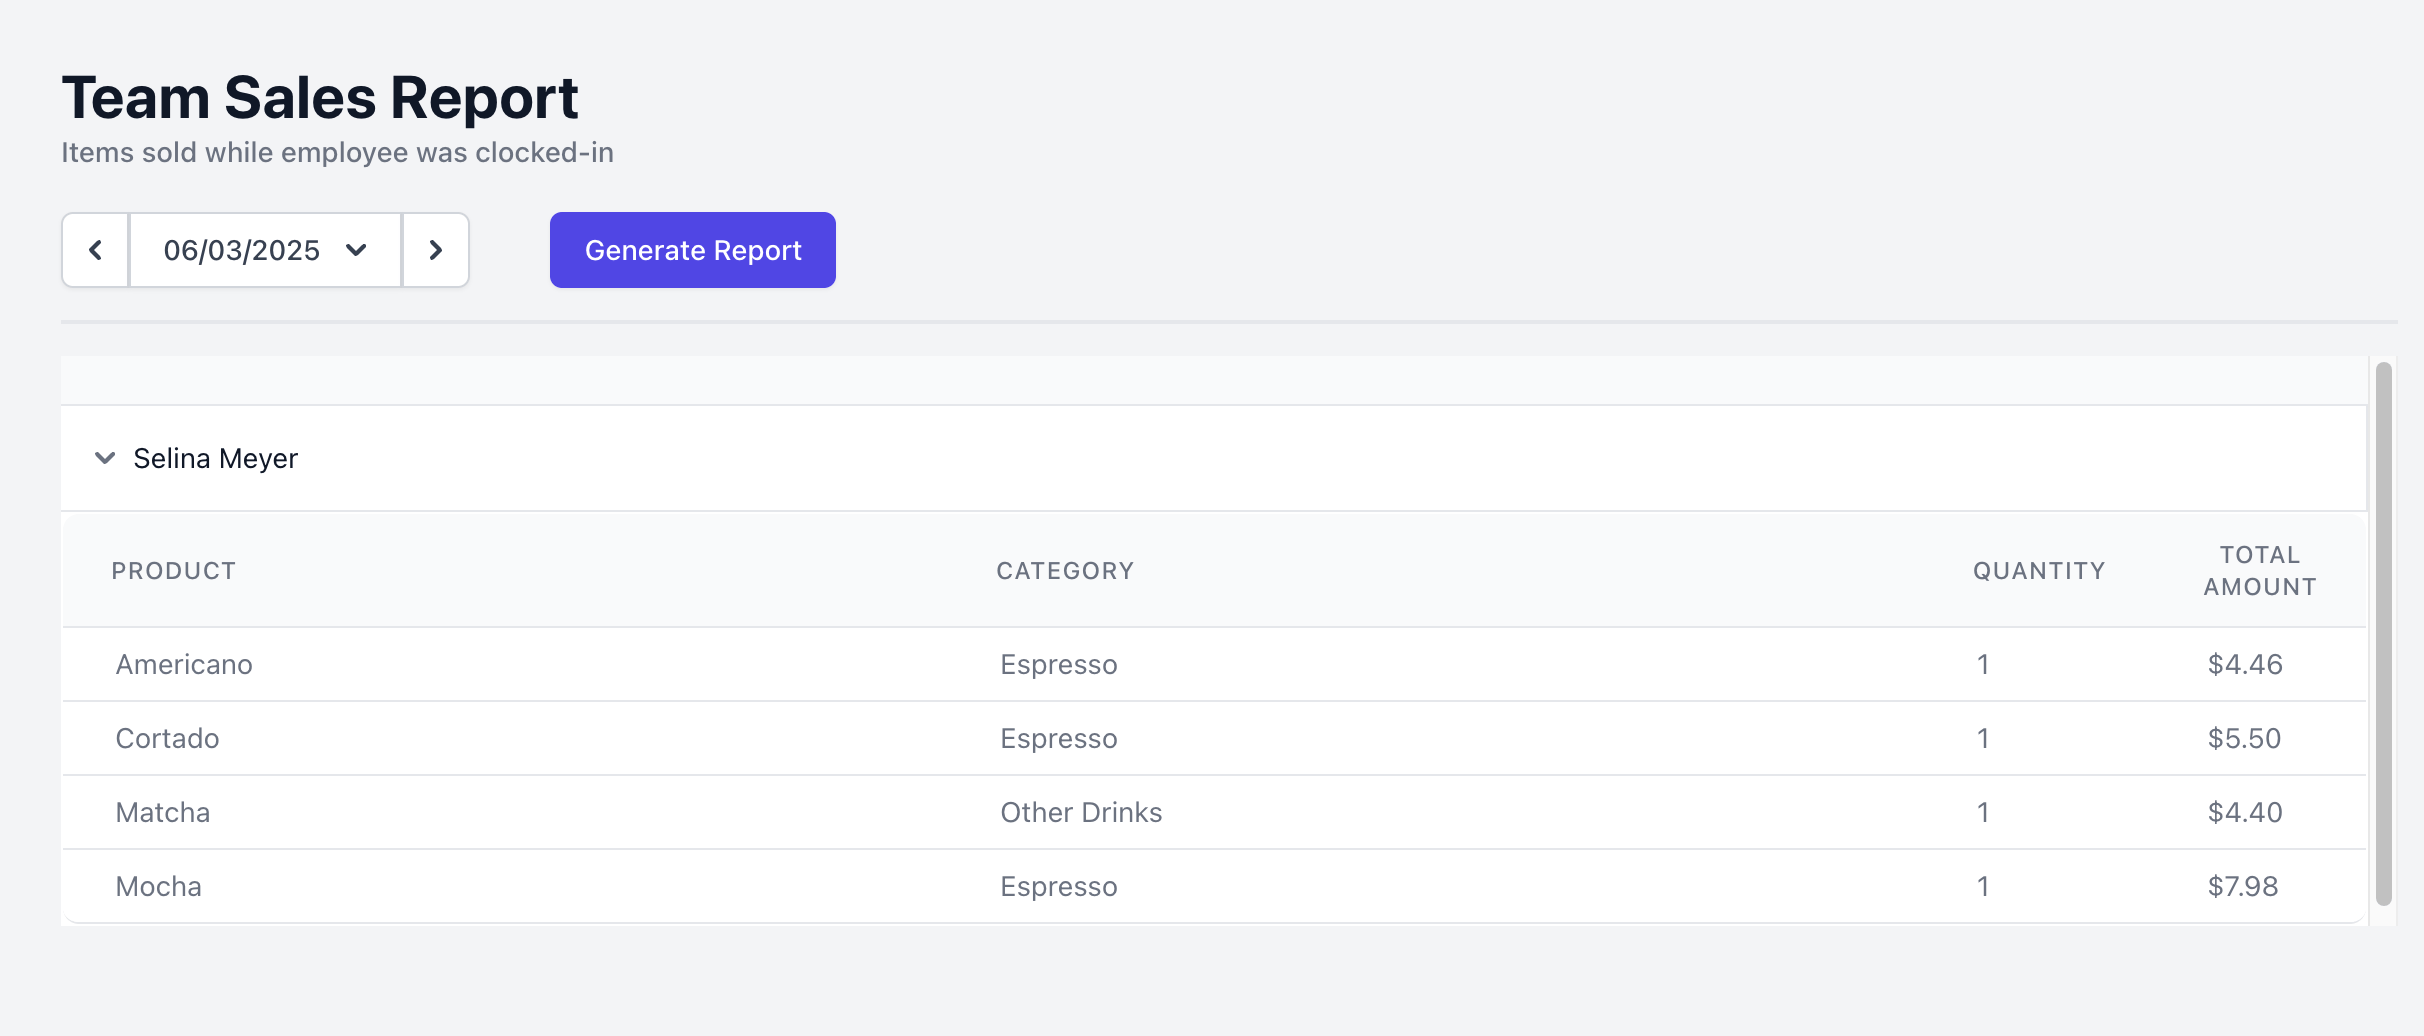
Cash Drawers
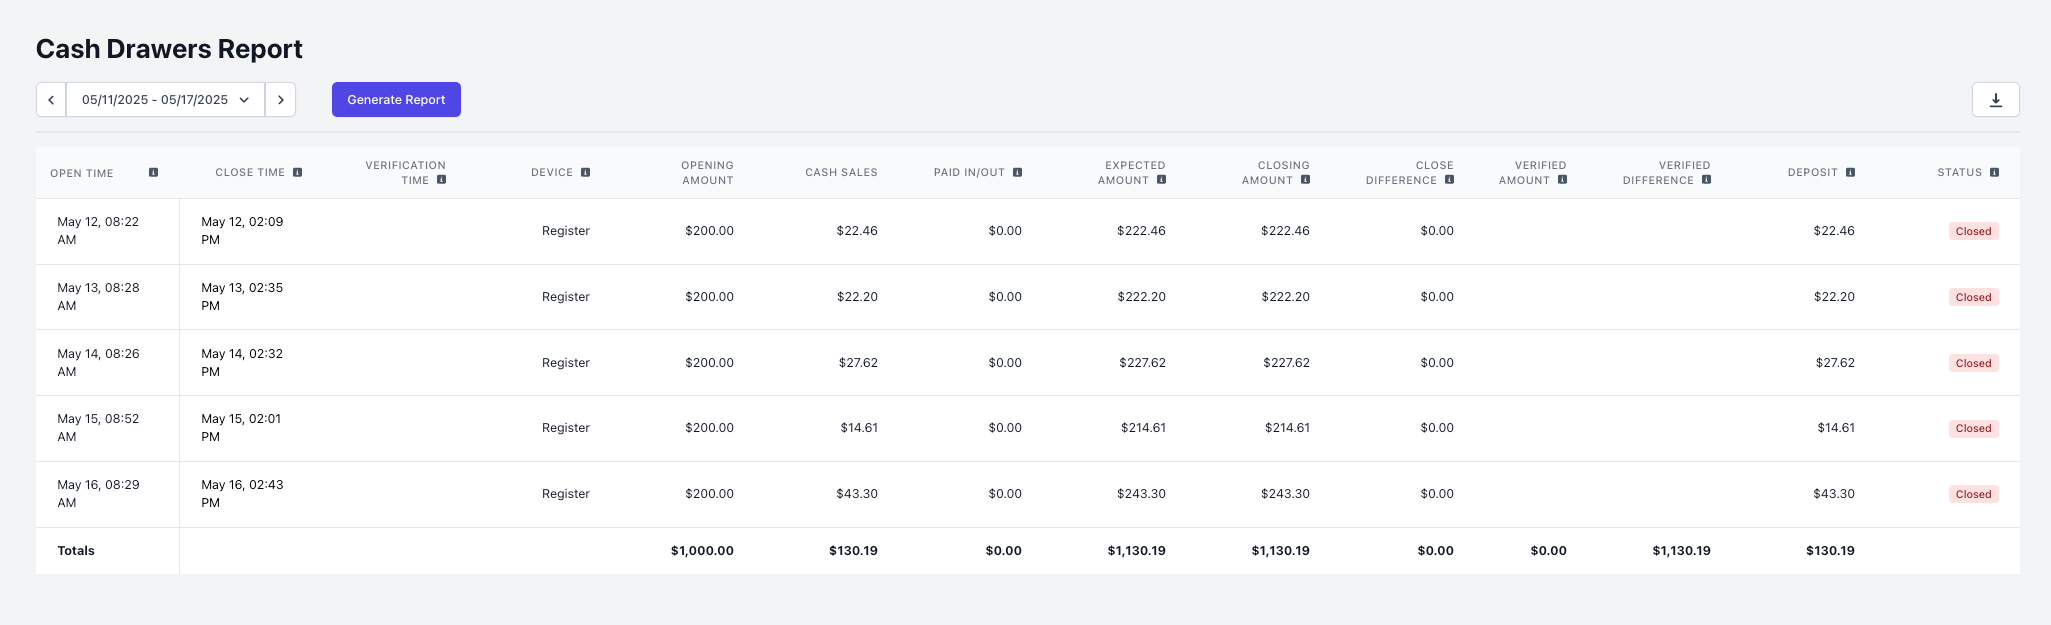
The Cash Drawers Report provides a detailed breakdown of the cash drawer events occurring on the POS.Clicking on a cash drawer row will reroute the page to a the corresponding cash drawer’s balance breakdown and events for more detailed information.
Report Line Items
Report Line Items
Open Time: The time the corresponding cash drawer was openedClose Time: The time the corresponding cash drawer was closedVerification Time: The time the corresponding cash drawer was verified by a manager after the drawer was closed. Information will only populate in this column if you have Cash Drawer Verification enabledDevice: The name of the POS device that the corresponding cash drawer was opened onOpening Amount: The amount the corresponding cash drawer was opened withCash Sales: The cash sales recorded within the corresponding cash drawerPaid In/Out: The total cash pay-ins less pay-outs recorded on the corresponding cash drawerExpected Amount: The sum of the corresponding cash drawer’s opening amount, total cash sales, and pay-ins, less pay-outsClosing Amount: The amount of cash recorded in the corresponding cash drawer once it has been closedClose Difference: The closing amount minus the expected amount calculated for the corresponding cash drawerVerified Amount: The amount of cash recorded in the corresponding cash drawer once it has been closed and verified. Information will only populate in this column if you have Cash Drawer Verification enabledVerified Difference: The difference between the verified amount and the closing amount for the corresponding cash drawer. Information will only populate in this column if you have Cash Drawer Verification enabledDeposit: The closing amount minus the cash remaining in drawer (drawer reset) amount for the corresponding cash drawerStatus: This column shows if the corresponding cash drawer is open, closed, or verified
Invoicing
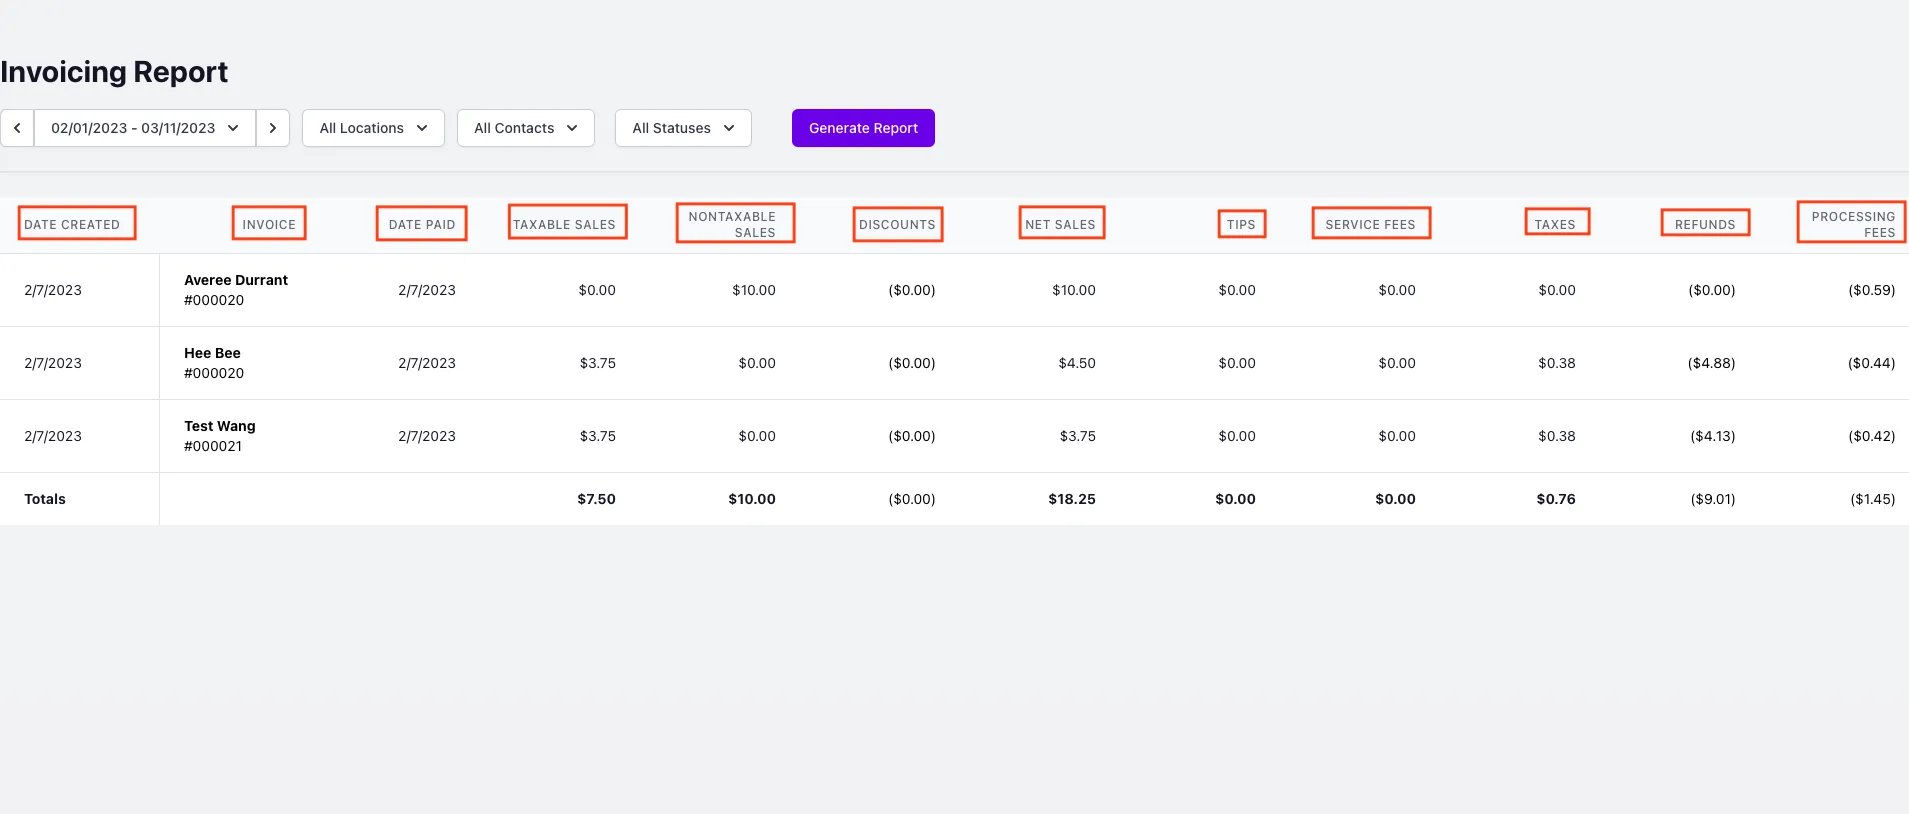
The Invoicing Report allows you to see a breakdown of all invoices paid off during your selected time period. You can access your shop’s Invoicing Report at any time from the Web Dashboard, Point of Sale, and Hub App. With this report, you have the option to choose the specific locations for which you would like to view paid invoices for. Additionally, you can also select the invoice contacts that you wish to include in the report, and specify the invoices you want included based on their status: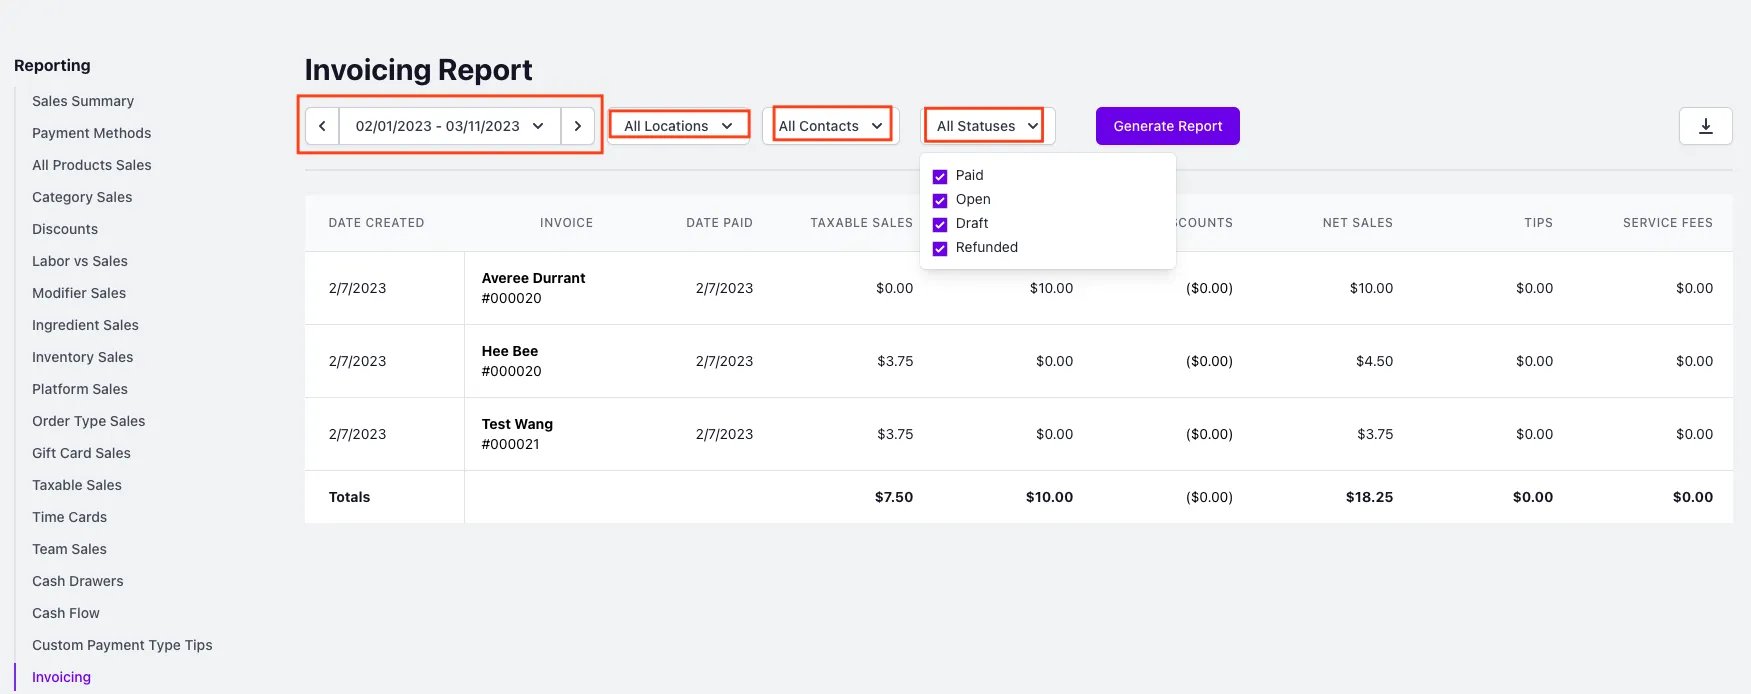
Report Line Items
Report Line Items
Date Created: This column will list the day that the invoice was created.Invoice: This column will list the name and number of the invoice.Location: This column will list the location in which the invoice was sent from.Date Paid: This column will list the day the invoice was paid on.Taxable Sales: The value under this column represents the total amount of sales collected from taxed products included in the invoice.Non-Taxable Sales: The value under this column represents the total amount of sales collected from non-taxed products included in the invoice.Discounts: The value under this column represents the amount that was discounted from products included in the invoice.Net Sales: The value under this column represents the total cost of the invoice after taking discounts into account.Tips: The value under this column represents the tips added onto the invoice.Service Fees: The value under this column represents any service fees included in the invoice.Taxes: The value under this column represents the total amount of taxes collected from sales included in the invoice.Refunds: The value under this column represents the amount that was refunded from the invoice.Processing Fees: The value under this column represents the total amount of processing fees collected when the invoice was paid.Total: The value under this column represents the total cost of the invoice after taking tips, service fees, taxes, refunds, and processing fees into account.
Ticket Completion
The Ticket Completion Report provides unique metrics that allow you to understand your shop’s efficiency in completing tickets. This report also allows you to compare statistics across multiple locations at once, over a variety of time and date selections. The report breaks down the average number of minutes it takes for tickets to be completed at your shop. Access your shop’s Ticket Completion Report at any time from the Dashboard.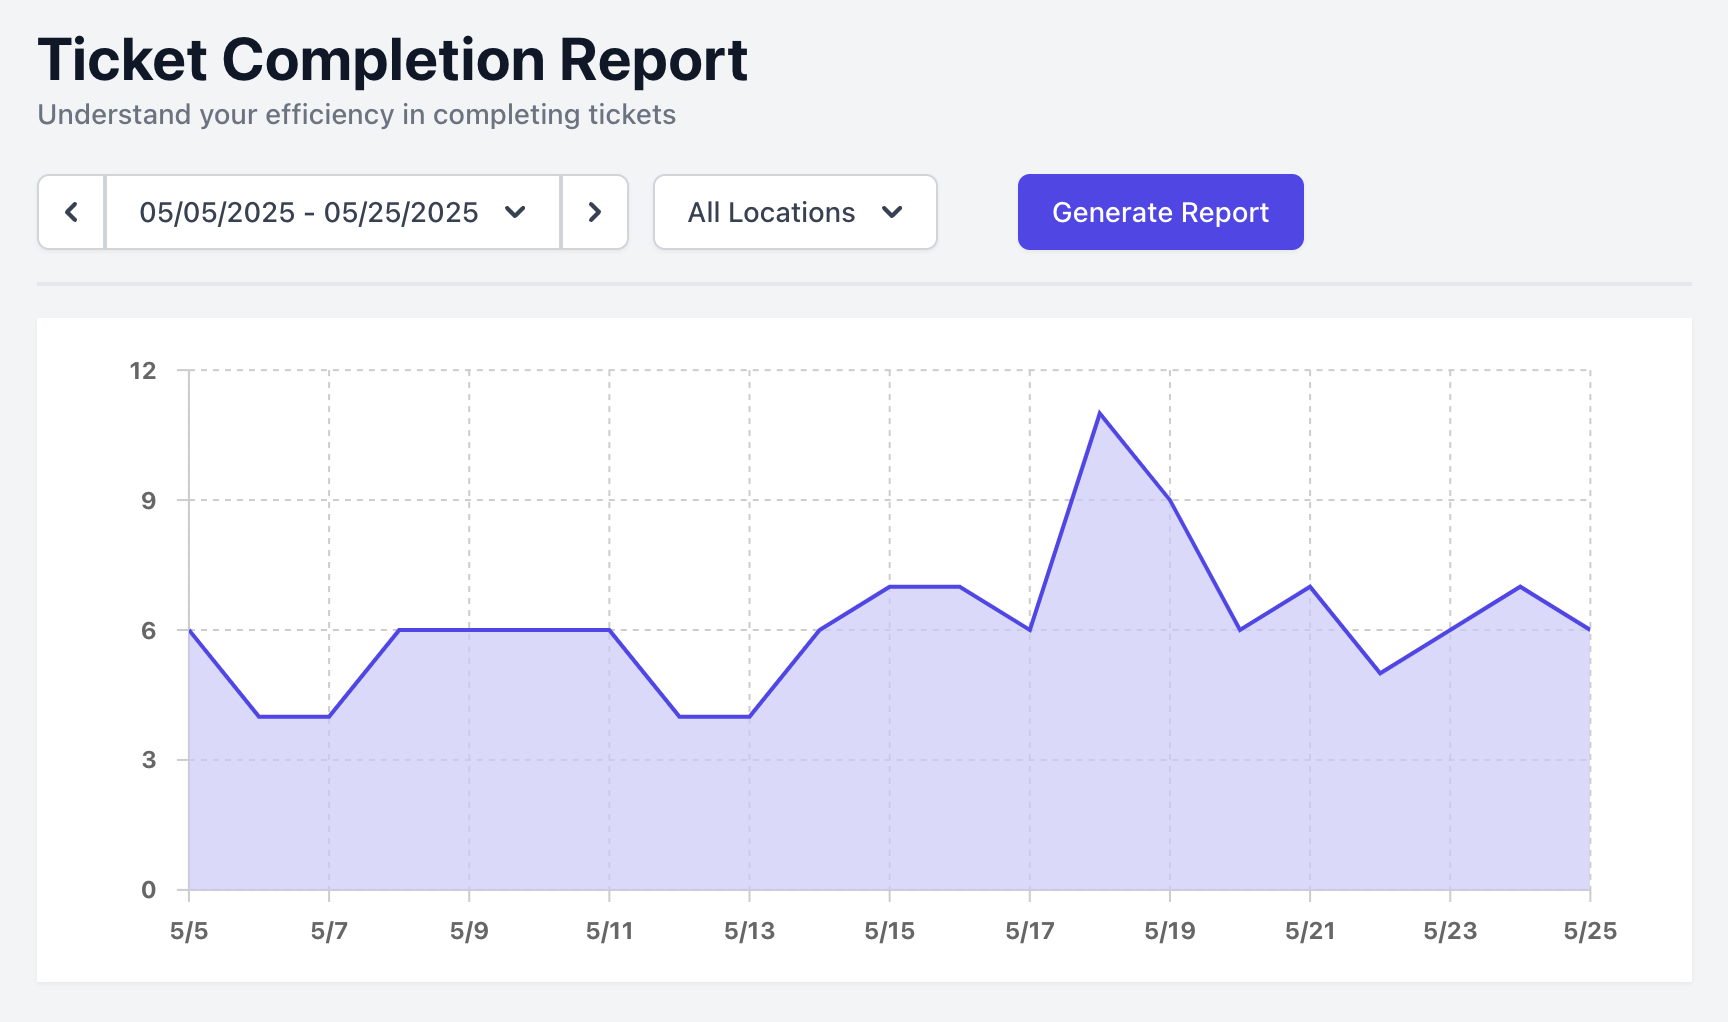
Report Line Items
Report Line Items
Average Ticket Completion Time: The average time, in minutes, it takes for tickets to be completedLocation: The specific location the data is referencing. This is useful for comparing performance across multiple shopsDate Range Selection: Allows you to choose the specific time period for the report, enabling analysis over various dates